
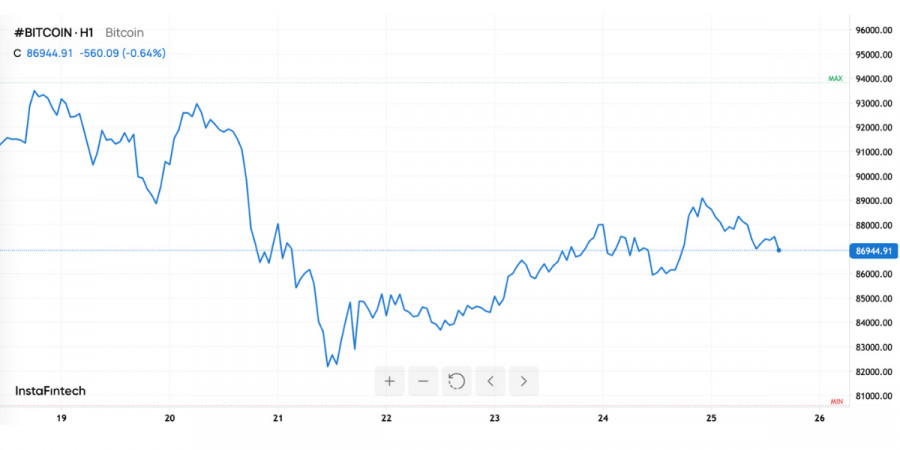
November 2025 was a reminder to Bitcoin that, even amid institutionalization and ETF inflows, the market remains highly volatile. After a sharp drop to seven-month lows, the largest cryptocurrency began a cautious recovery and, as of November 25, is trading around $88,000. Formally, this is a rebound; in reality, it's a phase of risk re-evaluation, where each new level is tested by liquidity, sentiment, and macroeconomic factors.
From the outside, the picture does not seem so dramatic: +0.2% for the day, a consolidation just below the psychological level of $90,000, and a gradual pull-up of altcoins, with Ethereum gaining about 4%. However, within the market, capital redistribution continues, purging excess leverage and re-evaluating expectations, which recently painted scenarios of "only growth" and targets above $100,000–120,000.
The correction in November cannot be called sudden. It became the point where several factors converged.
Firstly, there was the accumulation of long positions with high leverage around key levels above $90,000–95,000. The market lived for several months in a "buy the dip" mode, and any decline was bought up. This created the illusion of guilt-free growth and pushed traders to take on excessive risk.
Secondly, a gradual deterioration of the macro background began: discussions intensified about a longer period of high rates in the US, and market participants became more cautious toward risk assets in general. For Bitcoin, this means not only a decrease in the influx of new money but also a marathon exit of some capital to more predictable instruments.
Thirdly, institutional behavior played an important role. Major players, including funds that operate through spot and futures ETFs, began taking profits amid a historically strong year. This was not a "top drop," but a planned reset: for them, Bitcoin is no longer just an idea but a position in reporting that must show results.
All these factors converged into one narrative: a few powerful negative candlesticks were enough to trigger an avalanche of liquidations that swept the market to seven-month lows. The fall was amplified by algorithmic strategies triggered by the breakdown of key levels, accelerating the downward movement.
Is Bitcoin at $88,000 a turning point or a pause? The current liquidity picture for Bitcoin clearly shows why the recovery is happening in "steps" rather than a straight line upward.
The heatmap of orders and liquidations indicates two key clusters:
For investors, this means a simple thing: the market is currently living not just on fundamentals but also on the structure of positions. Sharp upward movements may be caused not by "pure" purchases but by forced position closures, while downward movements may be driven not only by panic but also by targeted ousting of leveraged players.
From a technical analysis perspective, the November correction dealt a significant blow to the medium-term trend structure. Falling below several key support levels and discussions about a potential "death cross" have increased caution even among bullish participants.
The "death cross" is the crossing of a shorter moving average down through a longer one. A classic example is when the 50-day moving average falls below the 200-day moving average. In the crypto market, this signal often accompanies either the start of a prolonged correction or the final phase of a panic drop, after which a reversal occurs.
The current situation is interesting because the technical picture and the fundamental arguments do not completely diverge. On the one hand, the trend has formally weakened, and many algorithmic models interpret this as a reason to reduce risk. On the other hand, fundamental stories for growth have not disappeared: institutional involvement, ETFs, limited supply, and anticipated rate-cutting cycles still favor Bitcoin over the horizon of several years.
In such zones, the market typically becomes maximally contradictory: some see the beginning of a bearish phase, while others view it as an uncomfortably deep but still healthy correction within the long-term bullish cycle.
Traditionally, November is considered one of the best months for Bitcoin. The average return over the past 12 years is close to 40+%, and this fact is often cited by advocates of seasonal patterns. However, 2025 showed that statistics are not guarantees but merely a backdrop.
The November correction is the collision of expectations for "yet another record season" with the reality that the market has already traveled a long path of growth and has become overloaded with leverage and optimism.
Historically strong November became more of a reason for more aggressive trading rather than a guaranteed "talisman." As a result, any deviation from the ideal scenario led to intensified position unwinding.

Beyond short-term volatility, it is essential to focus on the fundamentals that will determine what the next major cycle will look like.
Firstly, regulations. More and more jurisdictions are introducing clear rules for the operation of crypto exchanges, stablecoins, and custodial services. This reduces risk for institutional players but, at the same time, diminishes the effect of the "wild west" on which many high-return strategies of previous years were based. The market is becoming more transparent, making it less susceptible to extreme surges without fundamental reasons.
Secondly, competition. Bitcoin has to contend not only with stocks and gold but also with its own crypto environment: alternative L1 networks, DeFi development, and the tokenization of real assets. Nevertheless, its status as "digital gold" remains unique: limited issuance, the longest track record of security, and recognizability still make BTC a foundational asset for the market.
Thirdly, institutional interest. Despite corrections, the stock world has already passed the point of no return: Bitcoin has anchored itself in the strategies of at least some large managers. For some, this is a 1–2% portfolio; for others, a more aggressive stance. The main point is presence. This creates structural demand at times when prices appear "attractive" over the long term.
The current range around $88,000 is the zone where expectations are being re-evaluated.
If Bitcoin can confidently establish itself above $89,500–90,000 and move through the area of accumulated short liquidity, it may trigger a wave of accelerated recovery. In this scenario, both technical buyers and those awaiting confirmation of the correction's end will be activated.
If the market fails to overcome this threshold and pulls back to $85,000–86,000, it is most likely at this point that it will be determined whether the current correction remains a "working pause" within the bullish cycle or turns into a deeper and more prolonged decline.
Key factors that will influence the outcome:

HIZLI BAĞLANTILAR
show error
Unable to load the requested language file: language/turkish/cookies_lang.php
date: 2026-01-09 07:16:47 IP: 172.18.0.1


 Bize Ulaşın

