Nasdaq Composite se prodal o 1,9 %, zatímco S&P 500 klesl o 1 % v 15:00 SELČ. Průmyslový index Dow Jones pokračoval v mírně záporném teritoriu, když klesl o 0,4 %. Index Russell 2000 s malou kapitalizací klesl o 1,7 %. Fond Innovator IBD 50 ETF (FFTY) klesl o 0,8 %, od rána se však příliš nepohnul.
Objem byl nižší na Nasdaqu a vyšší na NYSE ve srovnání se stejnou dobou v pátek.
Globální trhy měly také klesající tendenci, což bylo vidět na německém DAXu, který klesl o 1,4 %, Euronext 100, který ztratil 0,6 %, a francouzském CAC 40, který klesl o 0,6 %. Londýnský index FTSE 100 uzavřel beze změny. V Asii klesl index Shanghai Composite o 1,3 %. Japonský Nikkei 225 vzrostl o 1,1 %.
Na Wall Street se společnost PepsiCo (PEP) chystá zítra před otevřením trhu oznámit své výsledky za druhé čtvrtletí. Akcie se nadále obchodují nad svými 50- a 200denními klouzavými průměry poté, co tyto klíčové úrovně v posledních několika dnech znovu získaly. PepsiCo vytváří základnu s nákupním bodem 177,72. Analytici očekávají mírný růst zisku za čtvrtletí ve výši 1,2 %.
Společnost Corcept Therapeutics (CORT) zaznamenala od 12. května, kdy dosáhla dna, raketový vzestup, což způsobilo, že se její hodnocení relativní síly zvýšilo z 85 na 97 bodů. Akcie nedávno překonaly průměrnou 12měsíční cílovou cenu analytiků na úrovni 27,50. V pondělí odpoledne však akcie klesly o 5,7 % a vrátily se do nákupního pásma na úrovni 25,78 bodu.
BioMarin, Evolent mezi pohybujícími se společnostmi
BioMarin Pharmaceuticals (BMRN) se vrací z báze dvojitého dna a stále se nachází v nákupním pásmu od nákupního bodu 86,69. Posílení ceny může být způsobeno větší rally na biotechnologických a farmaceutických akciích, která vede tyto akcie k nákupním bodům nebo cenovým průrazům.
Biotechnologická společnost Evolent Health (EVH), která byla minulý týden akcií dne IBD, se propadla pod nákupní bod na úrovni 33,24 bodu. Nedávná formace pohár s rukojetí a pozitivní výkonnost biotechnologických akcií v červnu naznačují možný růst akcií, a to i přes dnešní výprodej.
Lantheus (LNTH) se po únorovém proražení dvojitého dna nadále drží nad svým 50denním klouzavým průměrem. Zdá se, že výrobce zdravotnických produktů vytváří novou základnu.
Výnosy desetiletých státních dluhopisů mírně klesly. Bitcoin klesl o 1,52 %. ETF fond Invesco QQQ Trust (QQQ) klesl o 1,4 %.
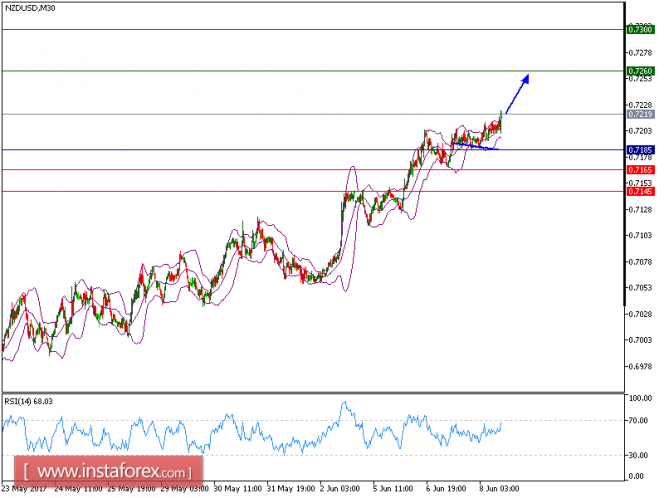
The pair is trading in a higher range as predicted. Today, NZD/USD is expected to continue its upside movement. The pair is consolidating above the key support at 0.7185, which should limit the downside potential. The relative strength index is mixed to bullish. Even though a continuation of the consolidation cannot be ruled out, its extent should be limited.
Therefore, as long as 0.7185 is not broken, look for a further rise to 0.7260 and even to 0.7300 in extension.
At present, the pair is trading above its pivot point. It is likely to trade in a higher range as long as it remains above its pivot point. Therefore, long position is recommended with the first target at 0.7260 and the second one at 0.7300. In the alternative scenario, short position is recommended with the first target at 0.7165 if the price moves below its pivot points. A break of this target is expected to push the pair further downwards, and one may expect the second target at 0.7145. The pivot point lies at 0.7185.
Strategy: BUY at dips, Stop Loss: 0.7185, Take Profit: 0.7260
Graph Explanation: The black line shows the pivot point; the present price above pivot point indicates the bullish position and below pivot points indicates the short position. The red lines shows the support levels and the green line indicates the resistance levels. These levels can be used to enter and exit trades.
Resistance levels: 0.7260, 0.7280, and 0.73000
Support levels: 0.7165,0.7145, and 0.7100

QUICK LINKS
ForexMart is authorized and regulated in various jurisdictions.
(Reg No.23071, IBC 2015) with a registered office at Shamrock Lodge, Murray Road, Kingstown, Saint Vincent and the Grenadines
Restricted Regions: the United States of America, North Korea, Sudan, Syria and some other regions.


 Contact Us