On Tuesday, the GBP/USD pair experienced significant growth, despite no clear catalyst behind it. On Monday, the dollar rose on specific grounds, but on Tuesday it fell for no apparent reason, simply because it's the dollar. As it turned out, even a reduction in global trade tensions is not enough to support the U.S. currency, despite earlier expectations for further dollar strengthening. The U.S. inflation report, showing a 2.3% increase instead of the forecasted 2.4%, ultimately pushed the dollar down.
Now, the market expects the Federal Reserve to resume its monetary easing cycle, despite Jerome Powell stating last week that the Fed should wait until at least summer to assess the impact of Trump's tariffs on the economy. Powell also noted that inflation could accelerate in 2025, so any rate cuts should be approached cautiously to avoid having to raise them again later. We tend to agree with Powell. However, the market has its own opinion.
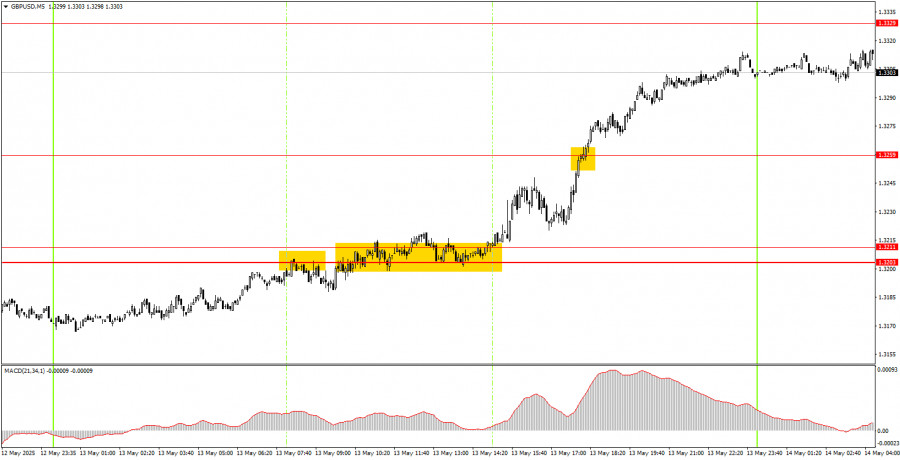
Three trading signals were formed on Tuesday on the 5-minute timeframe. Initially, the pair bounced off the 1.3203–1.3211 area, but that sell signal was false. Later, the price broke through this area, allowing for long positions to be opened. During the U.S. session, the 1.3259 level was also broken, and the price moved up another 40 pips. In summary, Thursday's dollar decline was understandable, but the market had consistently overlooked dollar-positive macroeconomic data before this event.
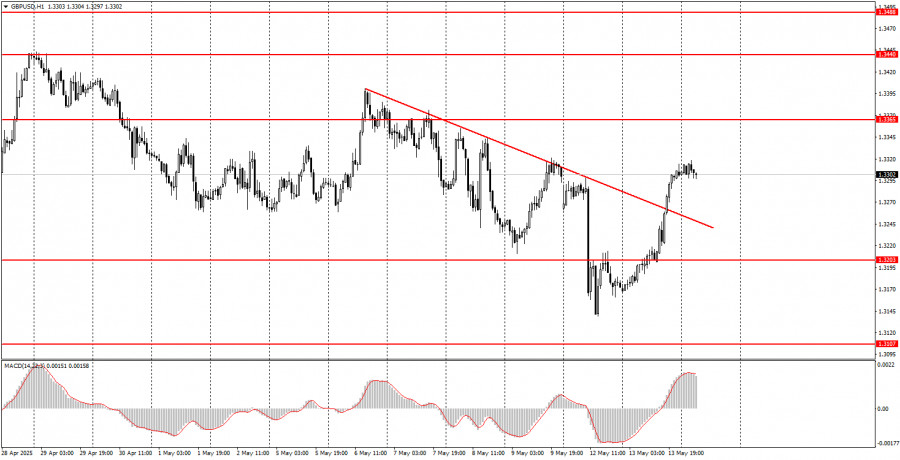
On the hourly timeframe, GBP/USD continues to react primarily to news involving Donald Trump and remains skeptical of his policies. Even the signing of a trade deal between the U.S. and the UK benefits the dollar, not the pound, as the dollar fell in response to any tariff or sanction-related news. Theoretically, the dollar should now be recovering on any news of de-escalation in the trade war, but we still see the market reluctant to support the greenback.
On Wednesday, the GBP/USD pair is projected to trade on technical factors, indicating that it may move in either direction.
On the 5-minute TF, it is now possible to trade at 1.2848-1.2860, 1.2913, 1.2980-1.2993, 1.3043, 1.3102-1.3107, 1.3203-1.3211, 1.3259, 1.3329, 1.3365, 1.3421-1.3440, 1.3488, 1.3537, 1.3580-1.3598. No important events and reports are scheduled for Wednesday in the UK and US, so the movements today are likely to be non-trending and not strong.
Support and Resistance Levels: These are target levels for opening or closing positions and can also serve as points for placing Take Profit orders.
Red Lines: Channels or trendlines indicating the current trend and the preferred direction for trading.
MACD Indicator (14,22,3): A histogram and signal line used as a supplementary source of trading signals.
Important Events and Reports: Found in the economic calendar, these can heavily influence price movements. Exercise caution or exit the market during their release to avoid sharp reversals.
Forex trading beginners should remember that not every trade will be profitable. Developing a clear strategy and practicing proper money management are essential for long-term trading success.

QUICK LINKS


 Contact Us

