The EUR/USD currency pair traded in a super-volatile manner on Thursday. The volatility was an "unreal" 47 pips. This occurred on a day when reports on U.S. Non-Farm Payrolls and unemployment were released, eagerly awaited by traders for a month and a half. As it turned out, the anticipation was in vain—the market remained "dead." Of course, we saw a brief spike of emotion within the first 10 minutes after the data was released, but that was where it ended.
To be honest, when was the last time the market reacted to significant labor and unemployment reports with only a 35-pip move? Non-Farm Payrolls reported a result more than double the forecast. The unemployment rate rose to 4.4%, which no trader expected. Two major reports, which the market effectively ignored, led to such minimal movement. Therefore, delving into the precise values and their meanings seems pointless. The market does not want to trade, and that's the point. Movements remain completely random, as the flat on the daily timeframe persists.
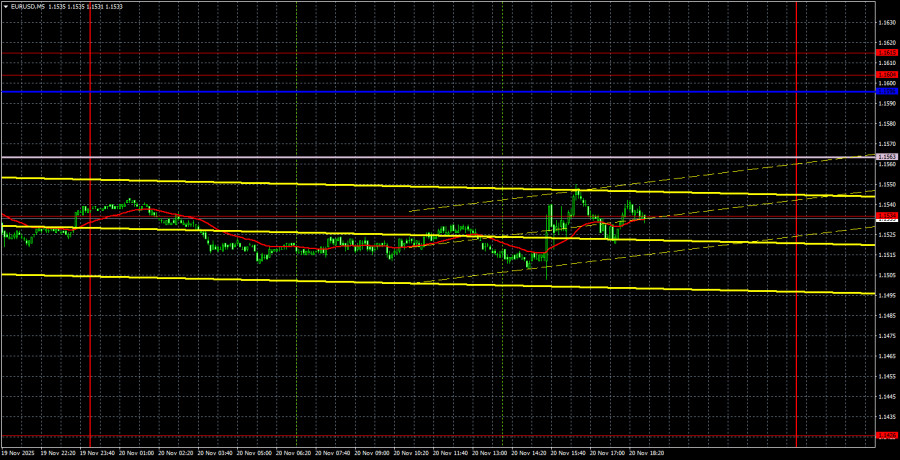
On the 5-minute timeframe, several trading signals were formed yesterday, but they occurred after the American data were published, when the market was in an elevated state and simply ignored technical levels. We believe there was no reason to buy the pair, as two Ichimoku indicator lines remain overhead.
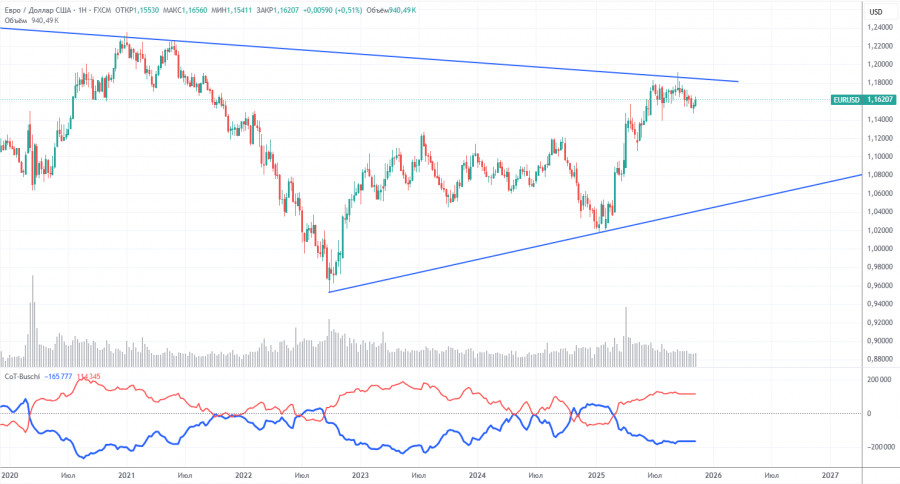
The latest COT report is dated September 23. Since then, no further COT reports have been published due to the U.S. "shutdown." In the illustration above, it is clear that the net position of non-commercial traders has long been "bullish," with bears struggling to gain the upper hand at the end of 2024 but quickly losing it. Since Trump took office for a second term as President of the U.S., the dollar has been falling. We cannot assert that the decline of the American currency will continue with 100% probability, but current world events suggest that this may be the case.
We still do not see any fundamental factors that would strengthen the euro, while there remain sufficient factors that would weaken the dollar. The global downward trend remains intact, but the past 17 years of price movements are now largely irrelevant. Once Trump concludes his trade wars, the dollar may start to appreciate, but when that happens is anyone's guess.
The position of the red and blue lines of the indicator continues to indicate the preservation of a "bullish" trend. During the last reporting week, the number of long positions in the "Non-commercial" group decreased by 800, while the number of shorts increased by 2,600. Consequently, the net position decreased by 3,400 contracts over the week. However, this data is already outdated and holds no significance.
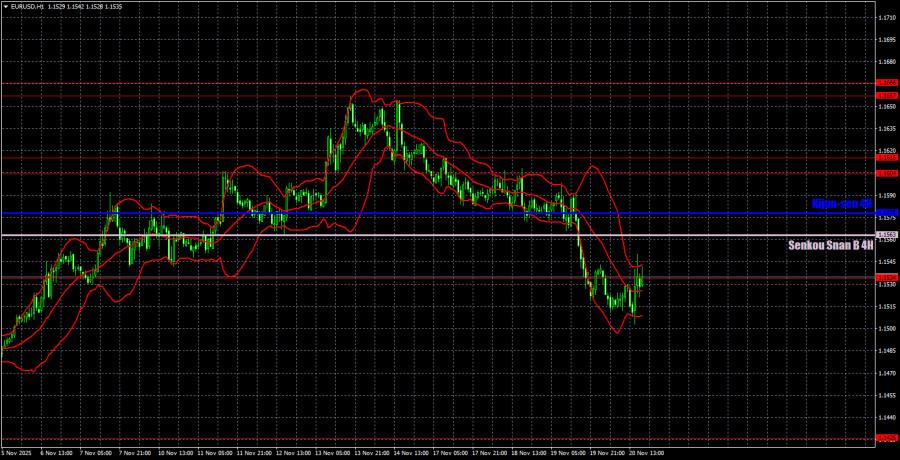
On the hourly timeframe, the EUR/USD pair continues to form a new upward trend, but it is on the verge of cancellation. The price remains within the sideways channel of 1.1400-1.1830 on the daily timeframe, so growth to 1.1800 can still be anticipated within the local trend. However, this movement requires price consolidation above the Senkou Span B line.
For November 21, we highlight the following significant levels for trading: 1.1234, 1.1274, 1.1362, 1.1426, 1.1534, 1.1604-1.1615, 1.1657-1.1666, 1.1750-1.1760, 1.1846-1.1857, 1.1922, 1.1971-1.1988, as well as the Senkou Span B line (1.1563) and Kijun-sen line (1.1578). The lines of the Ichimoku indicator may move during the day, which should be considered when determining trading signals. Don't forget to set a stop-loss order to breakeven if the price moves in the correct direction by 15 pips. This will protect against potential losses if the signal is false.
On Friday, there are no important events or reports scheduled in the Eurozone, while in the U.S., significant reports on service and manufacturing activity indexes are scheduled, as well as remarks from Christine Lagarde and the University of Michigan consumer sentiment index. However, if the market ignored much more significant reports yesterday, what can we expect from today's reports?
On Friday, traders may trade from the 1.1534 level. If the price consolidates below this level, short positions can be opened; if it consolidates above it, long positions can be opened. However, yesterday's events have once again proven what we have been stating tirelessly in recent weeks— the market does not want to trade, volatility is low, and logical movements are absent.

QUICK LINKS


 Contact Us

