Phân tích thị trường

Phần Phân tích Thị trường của Forexmart cung cấp thông tin cập nhật về thị trường tài chính. Phần tổng quan nhằm cung cấp cho bạn cái nhìn sâu sắc về các xu hướng hiện tại, dự báo tài chính, báo cáo kinh tế toàn cầu và tin tức chính trị có ảnh hưởng đến thị trường.

Disclaimer:  ForexMart không đưa ra lời khuyên đầu tư và phân tích được cung cấp không được coi là lời hứa về kết quả trong tương lai.

Hindenburg Research zaujímá pozici v provozovateli datových center Equinix

Akcie společnosti Equinix, provozovatele datových center, klesly v předobchodní fázi o více než 6 % v důsledku krátké pozice společnosti Hindenburg Research. Společnost Hindenburg Research, známá svými zprávami proti jiným společnostem, jako je indická Adani Group, tvrdí, že společnost Equinix nadhodnotila klíčový ukazatel ziskovosti zvaný upravené provozní prostředky a obchoduje se na nadhodnocených úrovních. Společnost Equinix, která je realitním investičním fondem, na tato obvinění bezprostředně nereagovala. Zpráva o krátké pozici vedla k poklesu akcií společnosti, protože investoři se zabývají možnými důsledky.

Technical Analysis of GBP/USD for January 26, 2022
03:02 2022-01-26 UTC--5

Technical Market Outlook

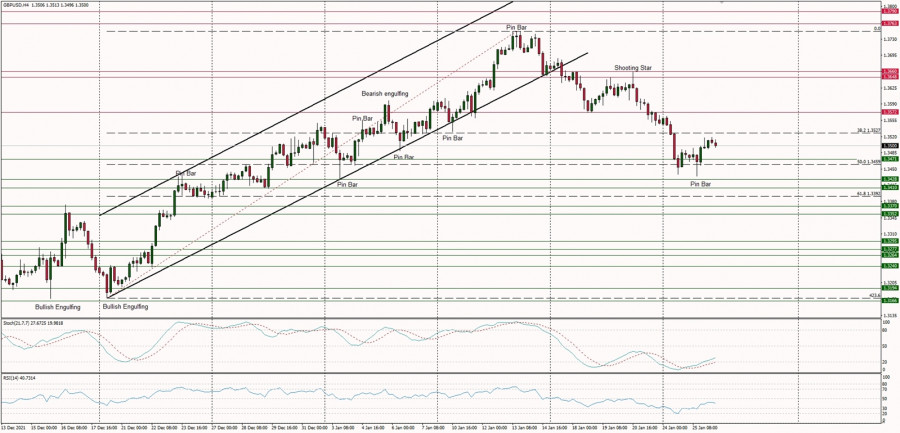
The GBP/USD pair bounce from the 50% Fibonacci retracement level was very short-lived and currently the market is reversing lower again. The next target for bears is seen at the 61% Fibonacci retracement located at 1.3392. The key technical support is seen at the level of 1.3428 - 1.3410. The momentum is weak and negative, but the market conditions on the H4 time frame chart are bouncing from the extremely oversold conditions, so the test of the nearest technical resistance located at 1.3572 is in view. On the larger time frame charts, like daily and weekly, the up trend is still being continued.

Weekly Pivot Points:

WR3 - 1.3781

WR2 - 1.3725

WR1 - 1.3618

Weekly Pivot - 1.3581

WS1 - 1.3476

WS2 - 1.3437

WS3 - 1.3329

Trading Outlook:

The up trend is being continued, but the up move might be terminated due to the Shooting Star candlestick pattern made at the daily time frame chart at the level of 1.3717. The overall move from the level of 1.3170 looks like a V-shape reversal pattern, so in the long-term the trend might be about to change from the multi-month down trend to the up trend. Please keep an eye on the level of 1.3500, because any sustained breakout below this level will change the outlook back to the bearish again.

Phản hồi

ForexMart is authorized and regulated in various jurisdictions.

(Reg No.23071, IBC 2015) with a registered office at Shamrock Lodge, Murray Road, Kingstown, Saint Vincent and the Grenadines

Restricted Regions: the United States of America, North Korea, Sudan, Syria and some other regions.


© 2015-2024 Tradomart SV Ltd.
Top Top
Cảnh báo Rủi ro:
Giao dịch ngoại hối có rủi ro mất tiền cao do đòn bẩy và có thể không phù hợp với tất cả các nhà đầu tư. Trước khi quyết định đầu tư tiền của mình, bạn nên xem xét cẩn thận tất cả các tính năng liên quan đến Forex, cũng như mục tiêu đầu tư, mức độ kinh nghiệm và khả năng chấp nhận rủi ro của bạn.