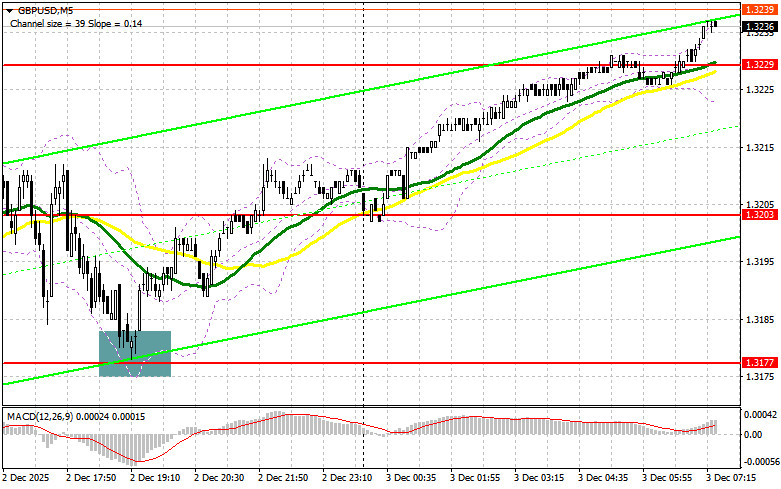
Yesterday, several entry points into the market were formed. Let's take a look at the 5-minute chart and analyze what happened there. In my morning forecast, I focused on the 1.3203 level and planned to make entry decisions based on it. A decline and the formation of a false breakout around 1.3203 provided a buying opportunity for the pound, but a significant rise in the pair did not materialize. In the second half of the day, active buying around 1.3177 created another buying opportunity for the pound, and this time the pair rose by more than 30 pips.
Good reports from the U.S. put pressure on the pound and support on the dollar, but the bears could not maintain control of the market. Active Asian purchases of GBP/USD indicate a possible continuation of the bullish market, but we should not rush to conclusions. In the first half of the day, we expect data on the UK services PMI and the composite PMI, as well as a speech by Bank of England MPC member Catherine L. Mann. Good reports will help the pound grow. In the event of weak data, buyers will need to defend the intermediate support at 1.3226. Only the formation of a false breakout there will be a reason to open long positions with the aim of raising the pair to the resistance at 1.3250. A breakout and reverse test from the top to the bottom of this range will increase the chances of strengthening GBP/USD, triggering sellers' stop orders and providing a suitable entry point for long positions, with a possible exit at 1.3272 – the weekly high. The furthest target will be around 1.3300, where I plan to take profit. In the event of a decline in GBP/USD and a lack of buyer activity at 1.3226, pressure on the pair will return, leading to movement towards the next support level at 1.3203. Only the formation of a false breakout there will be a suitable condition for opening long positions. I plan to buy GBP/USD immediately on the rebound from the low of 1.3177, targeting a 30-35-pip intraday correction.
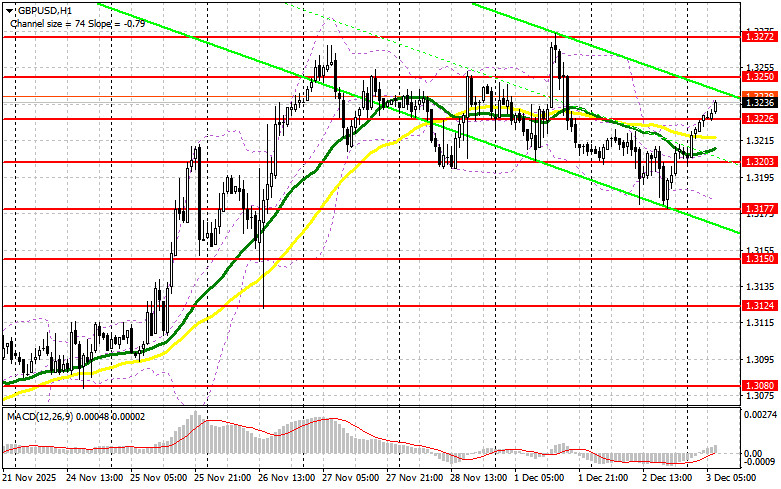
Sellers of the pound attempted yesterday to regain control of the market, but all their efforts were unsuccessful. Today, I expect their first manifestation around the resistance at 1.3250. Only the formation of a false breakout will be a reason to sell the pound, aiming for a decline towards the support level of 1.3226. A breakout and reverse test from bottom to top of this range will deal a greater blow to buyers' positions, leading to the triggering of stop orders and opening up the path to 1.3203, where slightly higher moving averages are aligned with the bulls. The furthest target will be around 1.3177, where I will take profit. In the scenario of GBP/USD rising and a lack of activity at 1.3250, buyers will continue to develop the bullish trend, which may lead to a spike towards 1.3272. I plan to open short positions there only on a false breakout. In the absence of downward movement there, I will sell GBP/USD immediately on a rebound from 1.3300, but only with the expectation of a correction of the pair downwards by 30-35 pips intraday.
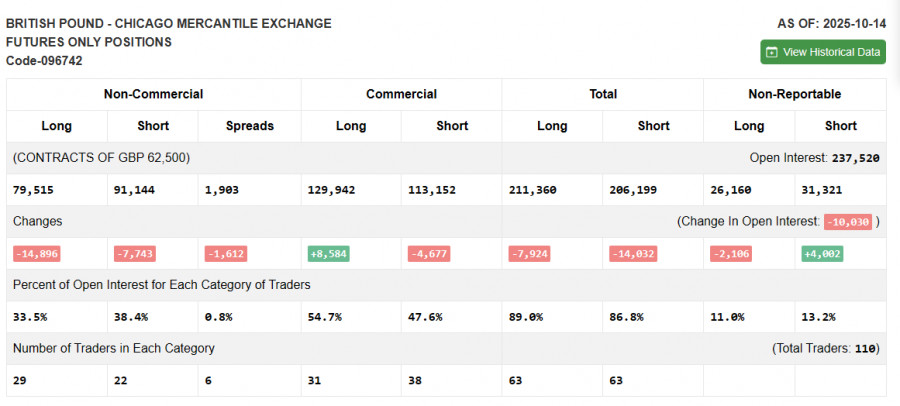
Due to the U.S. government shutdown, fresh Commitment of Traders data is not being published. As soon as the current report is prepared, we will publish it immediately. The latest data is only available from October 14.
The COT report (Commitment of Traders) showed a reduction in both short and long positions. Pressure on the dollar remains – especially after the latest data that will likely force the U.S. Federal Reserve to continue lowering interest rates. Meanwhile, the Bank of England's policy remains cautious, indicating its clear plans to continue fighting inflation. The short-term future dynamics of the GBP/USD exchange rate will be determined by new fundamental statistics. The latest COT report indicated that long non-commercial positions decreased by 14,896 to 79,515, while short non-commercial positions fell by 7,743 to 91,144. As a result, the spread between long and short positions decreased by 1,612.
Moving Averages
Trading is taking place above the 30 and 50-day moving averages, indicating attempts for the pound to rise.
Note: The period and prices of the moving averages are considered by the author on the hourly chart H1 and differ from the general definition of classic daily moving averages on the daily chart D1.
Bollinger Bands
In the event of a decline, the indicator's lower boundary around 1.3180 will act as support.

QUICK LINKS


 Contact Us

