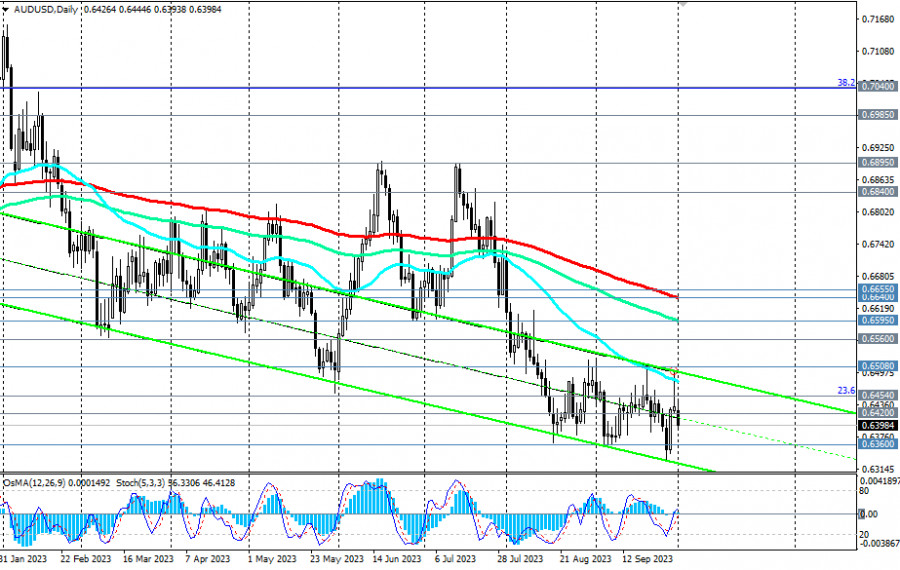
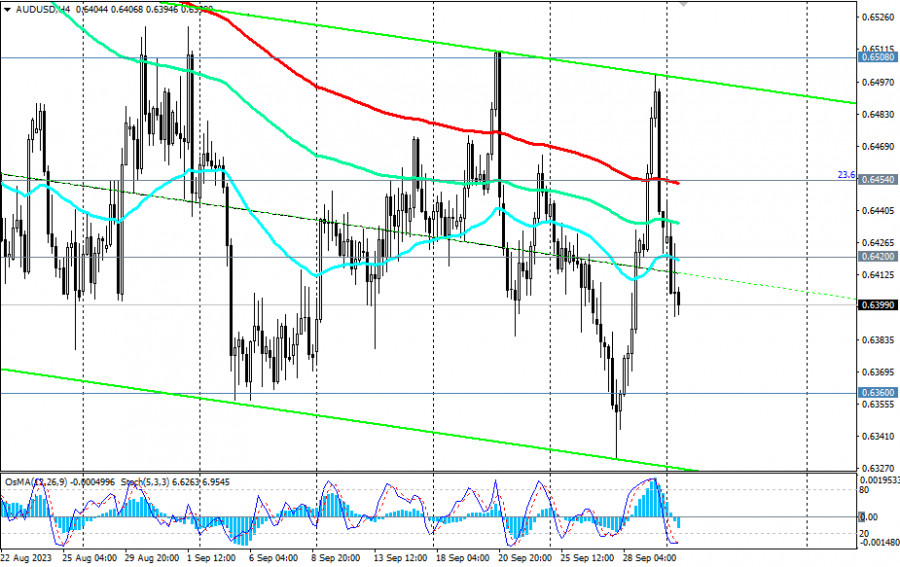
Despite the correction observed at the end of last week, AUD/USD remains in a bearish zone, short-term—below resistance levels of 0.6420 (200 EMA on the 1-hour chart), 0.6454 (200 EMA on the 4-hour chart), medium-term—below resistance levels of 0.6595 (144 EMA on the daily chart), 0.6640 (200 EMA on the daily chart), and long-term—below key resistance levels of 0.6895 (144 EMA on the weekly chart), 0.6985 (200 EMA on the weekly chart).

We also assumed that a break below today's low of 0.6394 may signal an increase in short positions on AUD/USD, which remains under pressure from strong fundamental factors.
The nearest targets here will be local support levels at 0.6360, 0.6335, and more distant ones will be at 0.6200, 0.6170 (2022 lows), 0.6100 (the lower boundary of the downward channel on the weekly chart).

In an alternative scenario, the price will break the important short-term resistance level of 0.6454 (200 EMA on the 4-hour chart and 23.6% Fibonacci level correction in the downward wave from 0.9500 to 0.5510) and rise to the important resistance level of 0.6480 (50 EMA on the daily chart). Its breakout, in turn, may trigger further corrective growth with targets at medium-term resistance levels of 0.6595 (144 EMA on the daily chart), 0.6640 (200 EMA on the daily chart), and 0.6655 (50 EMA on the weekly chart).
However, only a breakout of key resistance levels of 0.6985 (200 EMA on the weekly chart) and 0.7040 (38.2% Fibonacci level correction in the downward wave from 0.9500 to 0.5510) will bring AUD/USD into the long-term bullish zone.
Thus, short positions remain preferable.
Support levels: 0.6394, 0.6360, 0.6335, 0.6300, 0.6285, 0.6200, 0.6170
Resistance levels: 0.6420, 0.6454, 0.6480, 0.6500, 0.6515, 0.6560, 0.6595, 0.6600, 0.6640, 0.6655, 0.6700, 0.6740, 0.6800, 0.6840, 0.6895, 0.6900, 0.6925, 0.7000, 0.7010, 0.7040

QUICK LINKS