EUR/USD
Higher timeframes
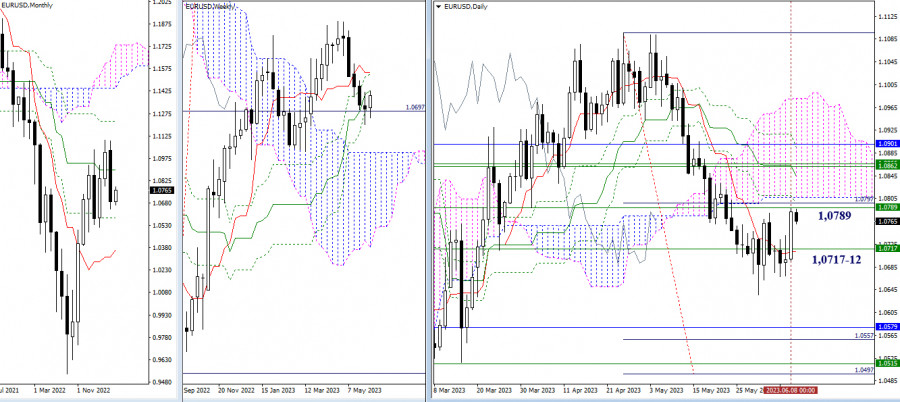
By the end of the week, bulls show activity, managing to rise towards the resistance of the weekly medium-term trend (1.0789). The next important step in this direction is consolidation in the daily cloud (1.0806) and testing the resistance of the weekly short-term trend (1.0866). The immediate support level is currently held at 1.0717-12 (the final level of the weekly golden cross + daily short-term trend).
H4 - H1
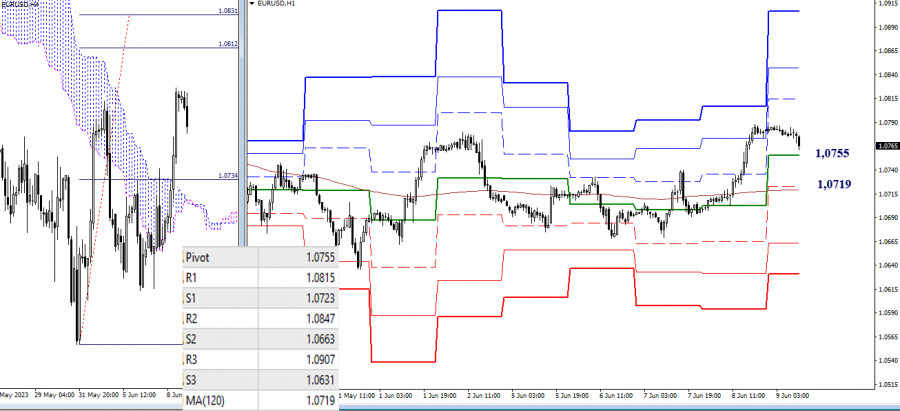
The main advantage at the moment is on the side of the bulls. However, a slight corrective decline is observed. The support levels for the development of the correction are currently the key levels of the lower timeframes at 1.0755 (central pivot point of the day) and 1.0719 (weekly long-term trend). The next supports are the classic pivot points, currently at 1.0663 and 1.0631. If the correction ends, the targets for the upside movement in the current situation can be noted at 1.0815 - 1.0847 - 1.0907, with the aim of breaking the H4 cloud (1.0812-31).
***
GBP/USD
Higher timeframes
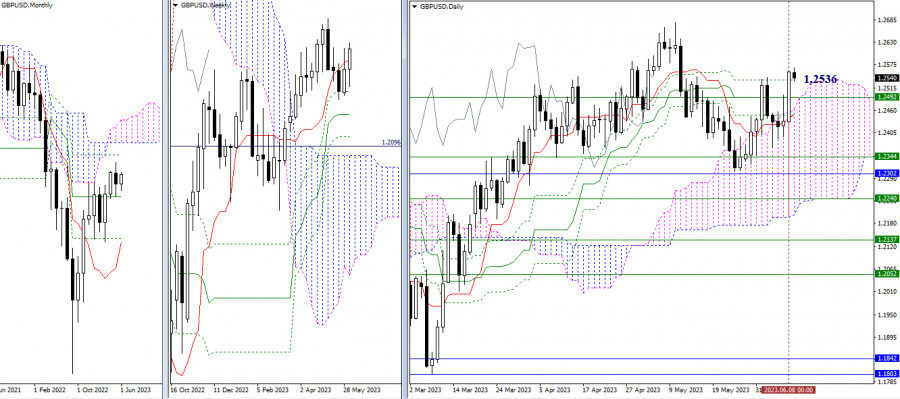
Bulls showed significant activity yesterday and, rebounding from supports in the area of attraction of the daily short-term trend (1.2427), surged above the unconquered resistances of the previous week at 1.2492 - 1.2536 (weekly short-term trend + final levels of the daily death cross of Ichimoku). A consolidation of the achieved result will make the next bullish target the local high (1.2678).
H4 - H1
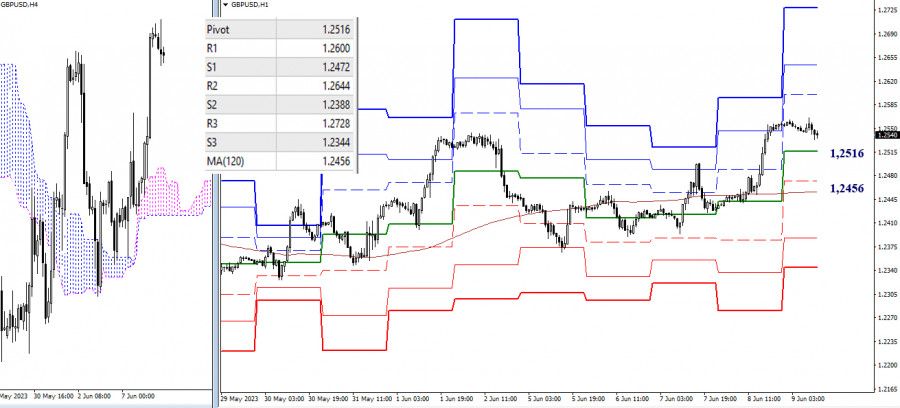
On the lower timeframes, the advantage currently belongs to the bulls. The targets for continued upside movement within the day are the classic pivot points (1.2600 - 1.2644 - 1.2728). However, if the emerging correction develops further, support may come from key levels located today at 1.2516 (central pivot point of the day) - 1.2456 (weekly long-term trend). A breakthrough and consolidation below these levels could change the current balance of power in favor of strengthening bearish sentiment.
***
The technical analysis of the situation uses:
Higher timeframes - Ichimoku Kinko Hyo (9.26.52) + Fibo Kijun levels
Lower timeframes - H1 - Pivot Points (classic) + Moving Average 120 (weekly long-term trend)

QUICK LINKS


 Contact Us

