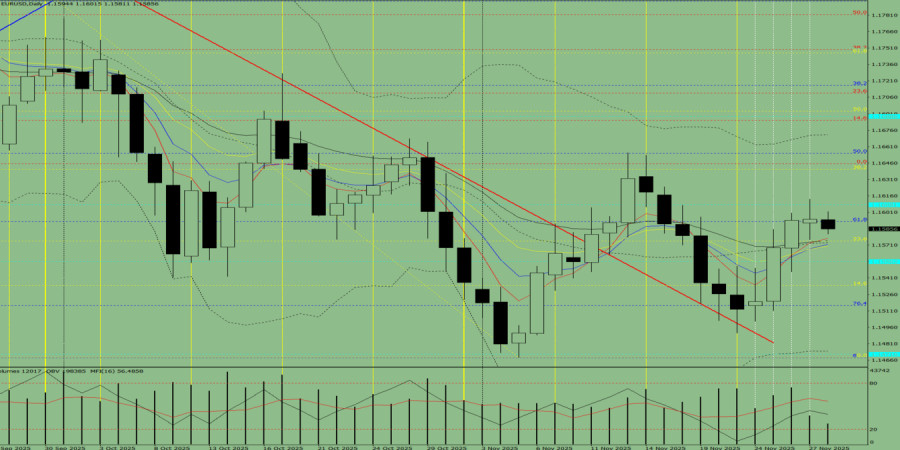
Trend Analysis (Fig. 1).
On Friday, the market may start moving downward from the level of 1.1595 (yesterday's daily candle close) with the target at 1.1556 — a historical resistance level (blue dashed line). When testing this level, a corrective upward price movement is possible with a target of 1.1575 — the 23.6% retracement level (yellow dashed line).
Fig. 1 (daily chart).
Comprehensive Analysis:
Overall conclusion: downward trend.
Alternative scenario: Today, from the level of 1.1595 (yesterday's daily candle close), the price may begin moving downward with a target of 1.1575 — the 23.6% retracement level (yellow dashed line). When testing this level, a corrective upward movement is possible with a target of 1.1592 — the 61.8% retracement level (blue dashed line).

QUICK LINKS


 Contact Us

