The EUR/USD currency pair traded with very low volatility and a downward bias on Tuesday. By the end of the day, the pair reached the Senkou Span B line, and the future trend we will observe in the coming weeks depends on this level. It's important to remember that the daily timeframe remains in a flat, meaning movements within the sideways channel of 1.1400-1.1830 can be entirely random and not dependent on fundamentals or macroeconomics. However, there were no significant events or news during the first two days of the week. The current correction could be beneficial, as it may help form an ascending trend line based on its extremes. We still believe the price is long overdue for an upward move purely on technical grounds within the sideways channel. Yet, once again, movements within a flat can be completely random.
This week, reports on Non-Farm Payrolls and unemployment levels will be published in the U.S. Thus, volatility may be higher tomorrow. However, this is unlikely to help traders, as market reactions may be ambiguous and chaotic, and it's impossible to predict the values of these reports at this time.
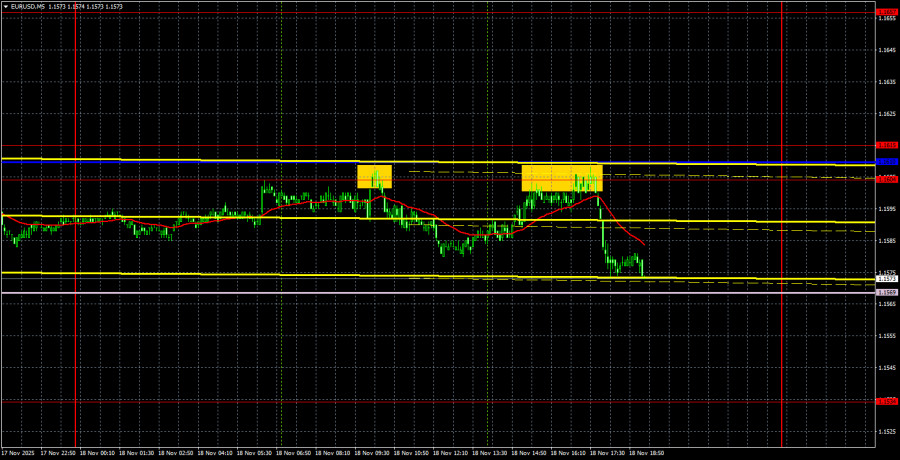
In yesterday's 5-minute timeframe, two sell signals were formed. The price bounced twice from the 1.1604-1.1610 area, losing approximately 15-20 pips on each occasion. The first trade had difficulty securing a profit, while the second could easily be closed manually closer to the evening, around the Senkou Span B line.
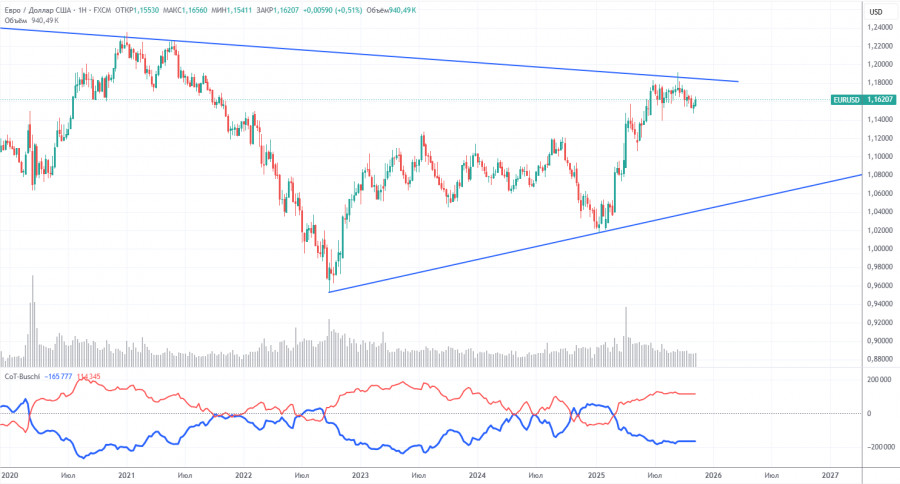
The latest COT report is dated September 23. Since then, no further COT reports have been published due to the U.S. "shutdown." In the illustration above, it is clear that the net position of non-commercial traders has long been "bullish," with bears struggling to gain the upper hand at the end of 2024 but quickly losing it. Since Trump took office for a second term as President of the U.S., the dollar has been falling. We cannot assert that the decline of the American currency will continue with 100% probability, but current world events suggest that this may be the case.
We still do not see any fundamental factors that would strengthen the euro, while there remain sufficient factors that would weaken the dollar. The global downtrend is still ongoing, but what difference does it make where the price moved in the last 17 years? Once Trump concludes his trade wars, the dollar may start to rise, but recent events indicate that the war will continue in one form or another for a long time yet.
The position of the red and blue lines of the indicator continues to indicate the preservation of a "bullish" trend. During the last reporting week, the number of long positions in the "Non-commercial" group decreased by 800, while the number of shorts increased by 2,600. Consequently, the net position decreased by 3,400 contracts over the week. However, this data is already outdated and holds no significance.
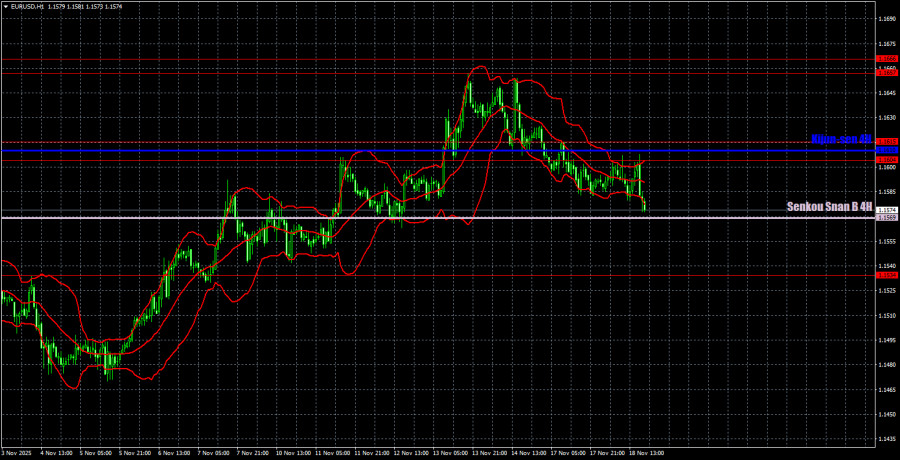
On the hourly timeframe, the EUR/USD pair continues to form a new upward trend. The rise of the euro does not align with the local macroeconomic backdrop and fundamentals, yet it completely aligns with the global ones. The price remains within the daily timeframe's sideways channel of 1.1400-1.1830, so an increase in the euro towards 1.1800 can indeed be expected soon, even within a local trend. The key is to stay above the Senkou Span B line.
For November 19, we highlight the following levels for trading: 1.1234, 1.1274, 1.1362, 1.1426, 1.1534, 1.1604-1.1615, 1.1657-1.1666, 1.1750-1.1760, 1.1846-1.1857, 1.1922, 1.1971-1.1988, as well as the Senkou Span B line (1.1569) and the Kijun-sen line (1.1610). The Ichimoku indicator lines may shift during the day, which should be taken into account when determining trading signals. Don't forget to set the Stop Loss order to breakeven if the price moves in the right direction by 15 pips. This will protect against potential losses if the signal turns out to be false.
In the Eurozone, the second estimate of October inflation is scheduled for release on Wednesday and is unlikely to be of significant interest to anyone. In the evening, the publication of the latest FOMC meeting minutes is also considered a secondary event. We can say that the news today will be very weak.
On Wednesday, traders may open long positions in the event of a bounce from the Senkou Span B line with a target of 1.1604-1.1615. Short positions will become relevant upon a consolidation below the Senkou Span B line, with a target at 1.1534.

QUICK LINKS


 Contact Us

