Akcie Singapore Airlines v pátek poklesly o 0,58 % poté, co společnost oznámila rekordní celoroční zisk za finanční rok končící v březnu.
Singapurská vlajková letecká společnost – v roce 2024 hodnocená společností Skytrax jako druhá nejlepší letecká společnost na světě – vykázala rekordní čistý zisk ve výši 2,78 miliardy singapurských dolarů (2,14 miliardy USD), což představuje meziroční nárůst o 3,9 % a překonalo průměrné odhady LSEG ve výši 2,25 miliardy SG$.
To však bylo způsobeno nepeněžním účetním ziskem ve výši přibližně 1,1 miliardy singapurských dolarů v návaznosti na dokončení fúze Air India a Vistara v listopadu 2024. SIA drží 25,1% podíl ve spojené společnosti.
Provozní zisk meziročně propadl o 37,3 % na 1,71 miliardy singapurských dolarů, zatímco tržby vzrostly o 2,8 % na rekordních 19,54 miliardy singapurských dolarů.
SIA vysvětlila, že pokles provozního zisku byl způsoben nižšími výnosy v důsledku tvrdší konkurence.
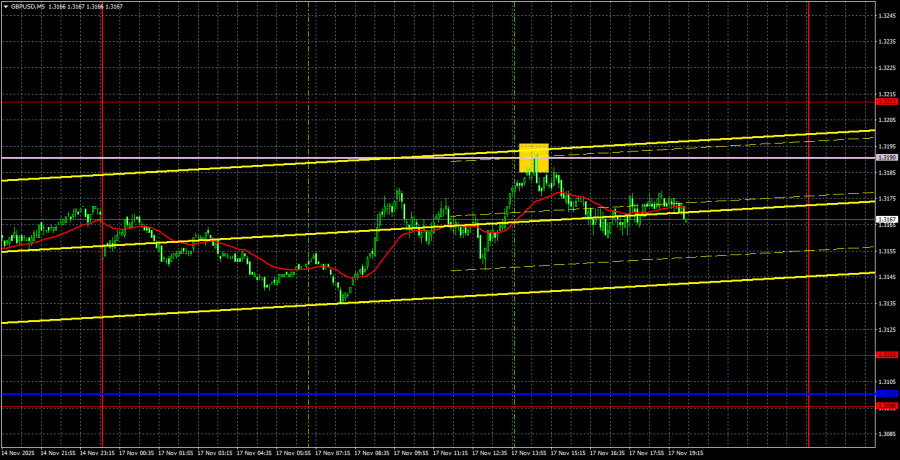
The GBP/USD currency pair traded within a sideways channel on Monday, bounded by the 1.3096 level and the Senkou Span B line. The price alternately bounces off one boundary of the channel and then the other, allowing traders to make some transactions in the currency market. The upward trend for the pound started a couple of weeks ago, breaking the descending trend line last week. Thus, there are more reasons to expect continued growth rather than a new decline. However, the pair needs to confidently overcome Senkou Span B and the level of 1.3212.
The fundamental backdrop for the British currency has not been great lately, but traders often interpret neutral and relatively unimportant events against the British currency. The macroeconomic background in the UK has also left much to be desired, but traders have happily ignored it. Therefore, we believe that, at this time, one should rely on the daily chart and its correction, as well as on the global fundamental background that is sharply against the dollar. Since, in essence, the entire movement of recent months is a correction, we still expect the global trend to resume from 2025.
On the 5-minute timeframe, one sell signal was formed yesterday. During the American trading session, the price bounced off the Senkou Span B line, leading to a drop of about 10-15 pips. That is how much traders could earn from the short position. But what can be said when the hourly timeframe has been in total flat for over a week?
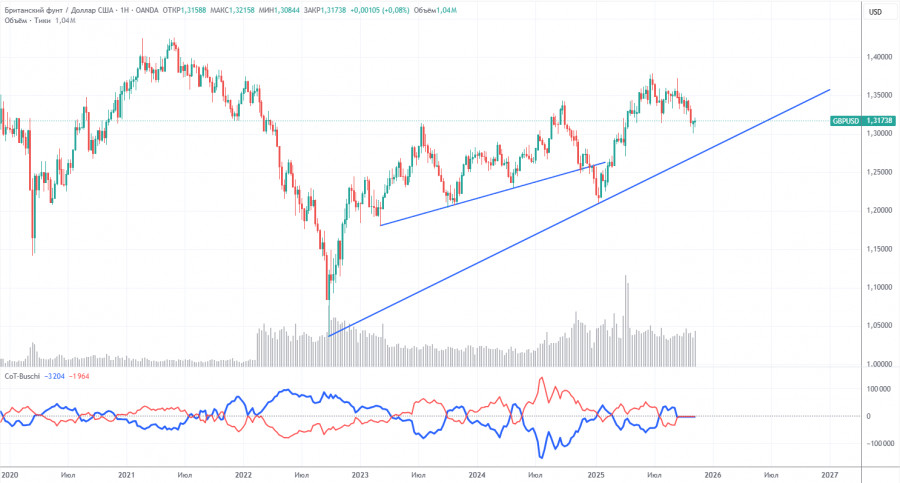
COT reports for the British pound show that commercial traders' sentiment has been changing constantly in recent years. The red and blue lines representing the net positions of commercial and non-commercial traders frequently cross each other and are mostly near the zero mark. Currently, they are at almost the same level, indicating approximately equal amounts of long and short positions.
The dollar continues to decline due to Donald Trump's policies, so market makers' demand for sterling is not particularly significant at the moment. The trade war will continue in one form or another for a long time. The Fed will, in any case, lower rates in the coming year, leading to a decline in dollar demand in one way or another. According to the latest report (dated September 23) on the British pound, the "Non-commercial" group opened 3,700 BUY contracts and closed 900 SELL contracts. Thus, the net position of non-commercial traders increased by 4,600 contracts over the week. However, this data is already outdated, and there are no new reports.
In 2025, the pound rose significantly, but one must understand that this was due to Donald Trump's policies. Once this reason is mitigated, the dollar may begin to rise, but when this will happen is anyone's guess. It does not matter how fast the net position for the pound is increasing or decreasing. The net position for the dollar is declining in any case, and it is generally declining faster.
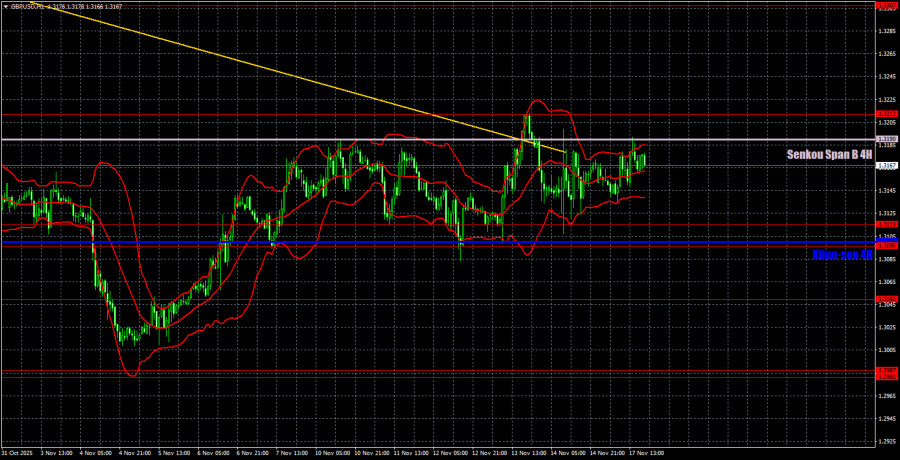
On the hourly timeframe, the GBP/USD pair finally broke through the trend line and surpassed the Senkou Span B line. It proved short-lived, yielding only a flat trend. In the coming weeks, a continuation of the British pound's growth can be expected, but the flow of uncontrolled negativity from the UK needs to stop. We believe that growth in the medium term will continue regardless of the local macroeconomic and fundamental backdrop, but for continuation, it requires overcoming the Senkou Span B line.
For November 18, we highlight the following important levels: 1.2863, 1.2981-1.2987, 1.3050, 1.3096-1.3115, 1.3212, 1.3307, 1.3369-1.3377, 1.3420, 1.3533-1.3548, 1.3584. The Senkou Span B line (1.3190) and Kijun-sen line (1.3100) can also be sources of signals. It is recommended to set the Stop Loss to breakeven upon the price moving in the correct direction by 20 pips. The Ichimoku indicator lines may shift during the day, which should be taken into account when determining trading signals.
For Tuesday, there are no important or interesting events scheduled in the UK or the US. Thus, throughout the day, trading will have to rely solely on technical analysis, and volatility may again be low while the flat continues.
Today, traders may consider selling if the price bounces off the 1.3212 level or the Senkou Span B line, with a target of 1.3115. Long positions will become relevant when the price solidifies above the level of 1.3212 with a target of 1.3307.

QUICK LINKS


 Contact Us

