So, the U.S. government shutdown is now a fact. However, the market — as expected — did not panic or start "selling America." On the contrary, the S&P 500 rose by 0.34%, and the U.S. dollar index slipped by a symbolic 0.03%. What did change meaningfully were U.S. Treasury yields — the 5-year yield fell from 3.73% to 3.67%, and the 10-year yield from 4.15% to 4.09%.
During the previous shutdown in December 2018, the markets also remained calm; equities continued to rally, and although the euro jumped 200 points at the peak of fear, it ended the 35-day shutdown only 60 points higher. Treasury yields also steadily declined back then.
What's different this time is that the stock market is already overheated — meaning it could fall independent of political drama. In such a case, investors would be left with only one rational decision: to buy government bonds and the U.S. dollar.
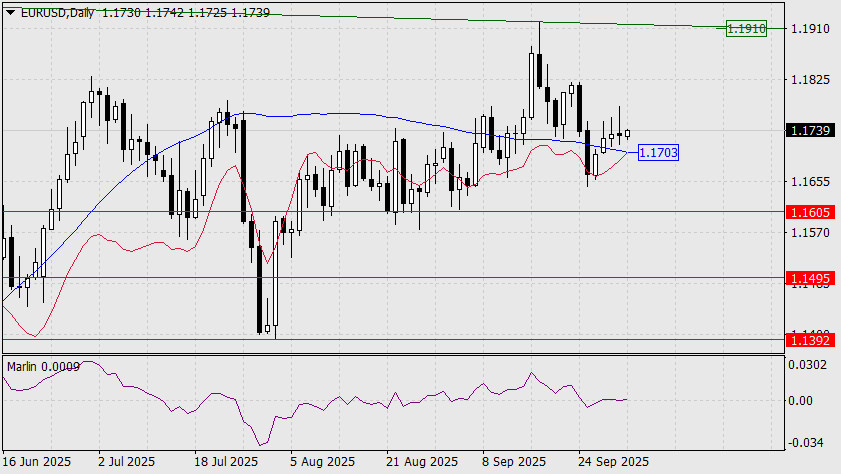
So far, there's an appearance of risk appetite — over the last three days, EUR/USD candles have developed long upper wicks, indicating sustained upside suppression. As noted in yesterday's outlook, conditions for sluggish euro growth remain in place, potentially extending toward the upper boundary of the price channel at around 1.1910. Whether this level will be reached depends largely on the effectiveness of political messaging and whether investors begin to rotate out of equities and into government debt.
A confirmed drop below the MACD line and under the 1.1703 level would be the first signal of shifting sentiment. The Marlin oscillator remains neutral at the moment. The nearest bearish targets are 1.1605 and 1.1495.
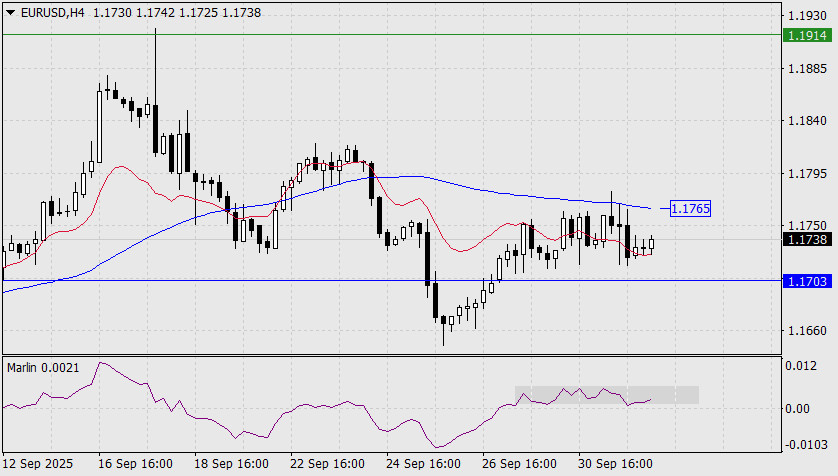
On the 4-hour chart, the Marlin oscillator is moving sideways within a moderately wide consolidation zone above the zero line — a sign that risk interest is still present. This sentiment could persist if the price breaks above the MACD line (1.1765). Conversely, a move below 1.1703 would amplify bearish pressure.

QUICK LINKS


 Contact Us

