
The rate of decline in retail sales in the EU accelerated from -1.2% to -2.0%, which at first glance is better than forecasts that indicated a decline to -2.2%. It is worth noting that the previous data was revised for the worse from -0.9% to -1.2%. In any case, there is a rather impressive decline in consumer activity in the EU, which is a negative factor for the economy.
During the American trading session, weekly data on jobless claims in the United States were published, which recorded growth. This is a negative factor for the US labor market.
Statistics details:
The volume of continuing claims for benefits rose from 1.346 million to 1.361 million.
The volume of initial claims for benefits rose from 190,000 to 219,000.
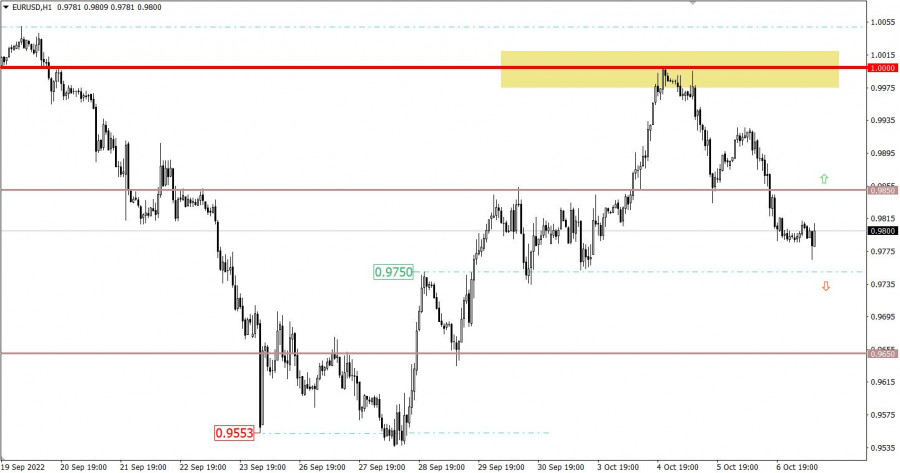
The EURUSD currency pair has corrected quite strongly from the parity level. In just 48 hours, the rate fell by more than 200 points, as a result, the 0.9850 variable support level was passed. Such a rapid decline could well lead to an overheating of euro short positions in the short term.
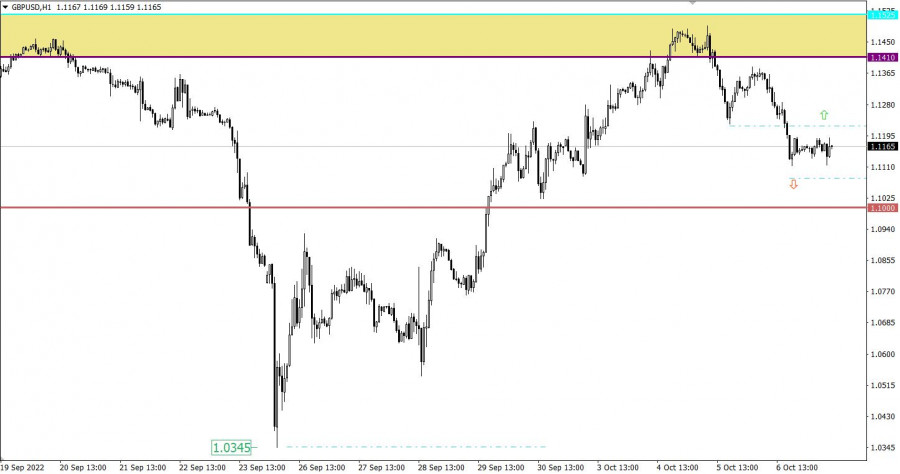
The GBP/USD currency pair has partially lost what it gained during the recovery period. In two trading days, there has been an active decline, as a result of which the quote fell by more than 300 points. The area of 1.1410/1.1525, relative to which a reverse movement has occurred, serves as resistance.
The main event of the outgoing week is considered to be the report of the United States Department of Labor, which is likely to have a strong impact on the market and speculators.
The unemployment rate is forecast to remain unchanged at 3.7%, while 290,000 new jobs could be created outside of agriculture. This is quite a lot, which can create prerequisites for a further reduction in unemployment. Everything indicates that the US dollar may still begin to strengthen, but we should not forget that the US currency is overbought, and everyone understands this very well. Thus, it may turn out that the report will come out well, but its indicators will be compared with the previous ones, where there was an increase in employment by 315,000. As a result, this factor will indicate a loss in the dynamics of the labor market recovery.
Time targeting:
US Department of Labor Report – 12:30 UTC
The downward scenario is considered by traders as an inertial one, where technical signals about the local oversold euro will be ignored. In this case, keeping the price below 0.9750 may well stimulate speculators to action.
As for the upward scenario, it will be considered by traders if the price returns above the level of 0.9850.
In this situation, the subsequent increase in the volume of dollar positions may occur when the price is kept below 1.1080, which will lead to a gradual decline to the values of 1.1020 and 1.0900.
The upward scenario will be taken into account if the quote holds above 1.1230 in a four-hour period.
A candlestick chart view is graphical rectangles of white and black light, with sticks on top and bottom. When analyzing each candle in detail, you will see its characteristics of a relative period: the opening price, closing price, and maximum and minimum prices.
Horizontal levels are price coordinates, relative to which a stop or a price reversal may occur. These levels are called support and resistance in the market.
Circles and rectangles are highlighted examples where the price of the story unfolded. This color selection indicates horizontal lines that may put pressure on the quote in the future.
The up/down arrows are the reference points of the possible price direction in the future.

QUICK LINKS
ForexMart is authorized and regulated in various jurisdictions.
(Reg No.23071, IBC 2015) with a registered office at Shamrock Lodge, Murray Road, Kingstown, Saint Vincent and the Grenadines
Restricted Regions: the United States of America, North Korea, Sudan, Syria and some other regions.


 Contact Us