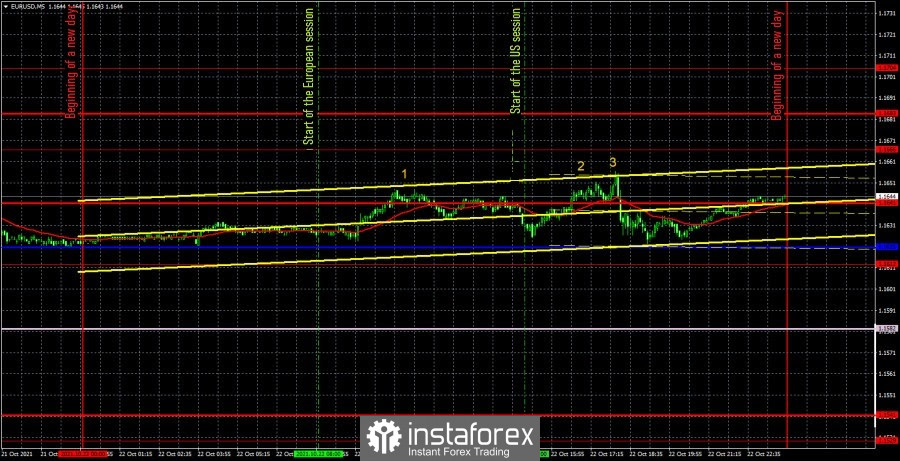
EUR/USD 5M
During the last trading day of the week, the EUR/USD pair continued to move as if there was no one on the market at all! Volatility was 35 points despite the fact that during the day there was a fairly large amount of macroeconomic statistics and we also had the speech of Federal Reserve Chairman Jerome Powell. Needless to say, not a single trading signal was formed during the day (although the price was approaching the Kijun-sen line) and for the better! For in such a flat, false signals could have formed, which would have led to losses. Thus, we can only consider the statistics and draw conclusions. The European Union published business activity indices in the services and manufacturing sectors. The first index fell from 56.4 to 54.7 points. The second - from 58.6 to 58.5 points. These data did not have any impact on the movement of the currency pair (figure "1" in the chart). The United States also released data on business activity. In the service sector, it increased from 54.9 points to 58.2. In the production sector, it decreased from 60.7 points to 59.2. But even this data had no effect on the mood of traders (figure "2" in the chart). The only event of the day that influenced the course of trading at least by a bit was Powell's speech, in which market participants considered a couple of hints at the curtailment of the quantitative stimulus program in November. Therefore, the US dollar has risen in price... attention... by 20 points (figure "3" in the chart). Thus, neither "macroeconomics", nor "foundation", nor "technique" impressed on Friday, October 22.
EUR/USD 1H
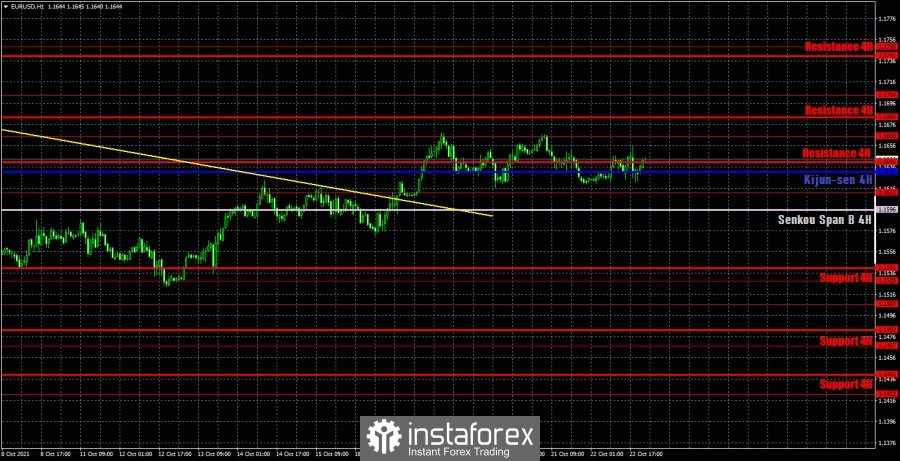
You can see that the euro/dollar pair has generally spent the last few days in an absolute flat on the hourly timeframe. Most of the movements took place between the levels of 1.1612 and 1.1666. Thus, the trend is now absent even on a higher timeframe, and nothing can be added to the conclusions on the lower timeframe. After the euro fell to the level of 1.1525, the quotes slightly moved up. It took them 12 days to go up 150 points... We highlight the following levels for trading on Monday - 1.1612, 1.1666 and 1.1704, as well as the Senkou Span B (1.1596) and Kijun lines -sen (1.1632). The Ichimoku indicator lines can change their position during the day, which should be taken into account when looking for trading signals. Signals can be rebounds or breakthroughs of these levels and lines. Do not forget about placing a Stop Loss order at breakeven if the price moves 15 points in the right direction. This will protect you against possible losses if the signal turns out to be false. Also, do not forget that the lines of the Ichimoku indicator lose their strength in a flat, so they can even be ignored, especially the Kijun-sen line. Or work out only when there are really strong signals. The calendars of macroeconomic events in the European Union and the United States are practically empty on October 25. The consumer confidence report for October will be published in the United States. But what is the likelihood that there will be at least some market reaction to it if much more important events were ignored on Friday?
We recommend you to familiarize yourself:
Overview of the EUR/USD pair. October 25. Jerome Powell did not help the dollar and did not give specifics to the markets
Overview of the GBP/USD pair. October 25. The British are no longer happy with Brexit. Negotiations on the Northern Ireland Protocol will continue
Forecast and trading signals for GBP/USD for October 25. Detailed analysis of the movement of the pair and trade deals.
Analysis of the COT report
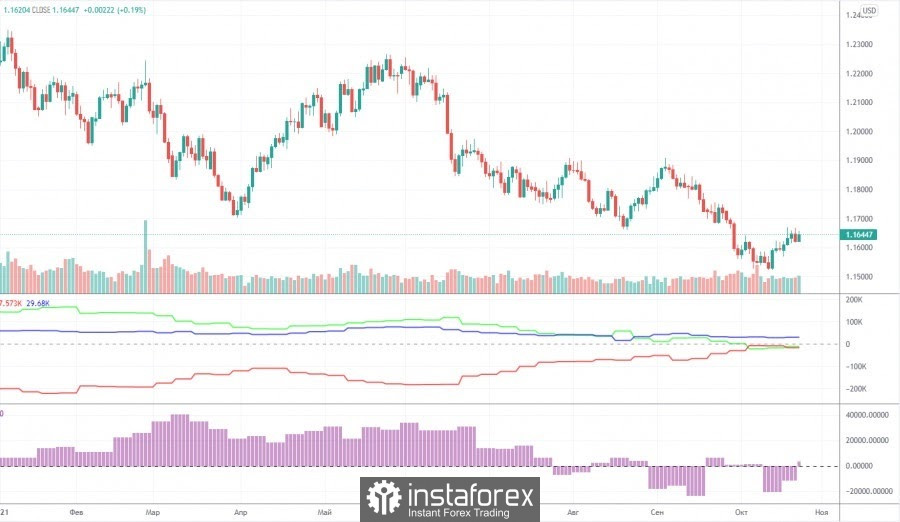
The mood of non-commercial traders changed into a bullish direction during the last reporting week (October 12-18). During the reporting week, 8,500 buy contracts (longs) and 16,000 sales contracts (shorts) were closed. Thus, the net position of the "non-commercial traders" group, which is the most important group, increased by 7.5 thousand. And here it is just right to talk about the "disease of the British pound." Let us remind you that the net position of professional pound players has been jumping up and down over the past few months. And this, in turn, indicates that there is no single mood and clear trend. We are seeing the same thing now in the euro currency. This is eloquently signaled by the second indicator, which shows either an increase in the net position or a decrease. Consequently, at this time, major players do not understand what to do next with the euro currency. Also, in the chart above, you can see that the pair rate went only 100 points below the previous local low. Therefore, at this time, the entire technical picture of the long-term plan still looks like a standard three-wave correction. Therefore, from our point of view, the formation of a new upward trend in the near future is still very likely, given the attempts with which the European currency has been falling over the past 8-9 months. But at the same time, we remind you that while there are no buy signals, you should not rush to the market with long positions. Any fundamental hypothesis requires specific technical confirmation. If they are not there, then you should not make the appropriate trading decisions.
Explanations for the chart:
Support and Resistance Levels are the levels that serve as targets when buying or selling the pair. You can place Take Profit near these levels.
Kijun-sen and Senkou Span B lines are lines of the Ichimoku indicator transferred to the hourly timeframe from the 4-hour one.
Support and resistance areas are areas from which the price has repeatedly rebounded off.
Yellow lines are trend lines, trend channels and any other technical patterns.
Indicator 1 on the COT charts is the size of the net position of each category of traders.
Indicator 2 on the COT charts is the size of the net position for the non-commercial group.

QUICK LINKS


 Contact Us

