On Monday, the EUR/USD currency pair once again traded lower, despite having no fundamental reason to do so. There were no economic reports, and no meaningful speeches occurred on the first trading day of the week. Only Donald Trump, who triggered crashes in both crypto and equity markets on Friday, surfaced to say that things "will be fine" between the U.S. and China. Thanks for that.
As before, we view the recent strength in the U.S. dollar as completely illogical. There are no fundamental or macroeconomic justifications for dollar appreciation at this time. The situation is starting to resemble the recent crypto crash, when prices dropped dramatically in just 15 minutes without a clear cause—later attributed to Trump's tariff announcements. It doesn't matter if he rolls out tariffs every other day; moves of that scale still surprise.
Thus, we interpret the current decline in EUR/USD simply as a phase to be waited out. If technicals and fundamentals both pointed to a decline, there would be no question. But selling the pair while every indicator and report suggests "buy" is not the wisest strategy. Intraday short positions are still valid—EUR/USD can fall locally for several more weeks. However, in the medium term, the outlook remains bullish.
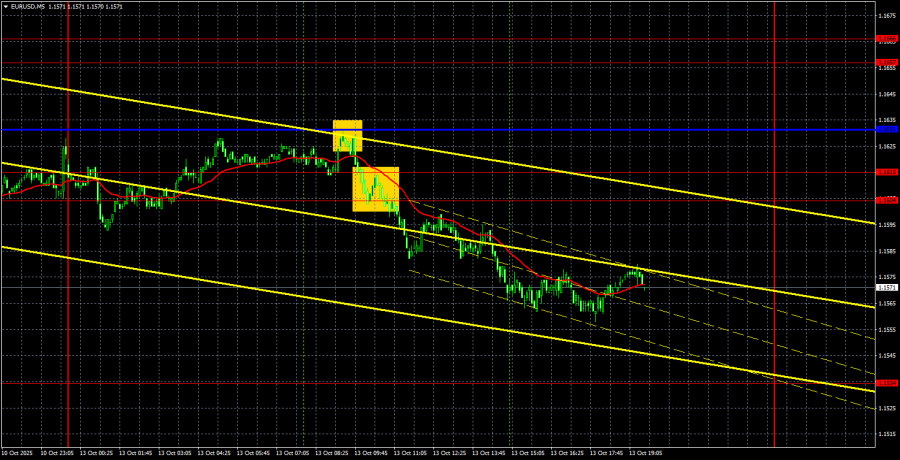
On the 5-minute chart, two sell signals were generated yesterday. The price first bounced off the critical line, then broke through the 1.1604–1.1615 area. These setups allowed traders to open short positions and manually close them for a profit by the evening.
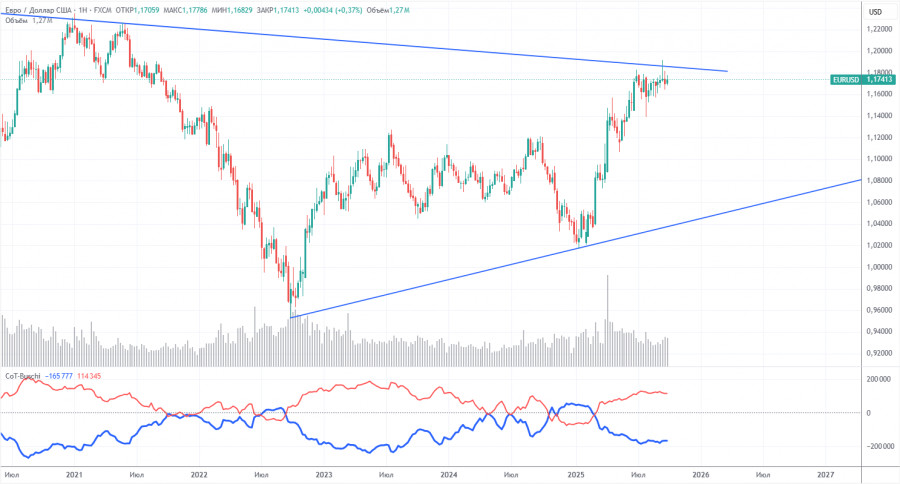
The latest Commitment of Traders (COT) report is dated September 23. It clearly shows that the net position of non-commercial traders had long remained bullish. Bears briefly took over at the end of 2024, only to quickly lose control again. Since Trump began his second term as U.S. president, the dollar has consistently fallen.
We cannot guarantee that the dollar will continue to decline with 100% certainty, but current global conditions suggest that outcome is likely. We still see no fundamental reasons for euro strength, but numerous factors support continued dollar weakness.
The global downtrend remains intact, but at this point, historical price direction over the past 17 years is increasingly irrelevant. Once Trump ends his trade wars, the dollar might start to rise—but events so far suggest the conflict is far from over.
The potential loss of Fed independence remains a major bearish factor for the U.S. currency.
As shown in the chart, the red and blue lines (longs vs. shorts) indicate that the bullish trend continues. During the last reporting week, non-commercial longs decreased by 800 contracts, while shorts increased by 2,600. As a result, the net position declined by 3,400 contracts.
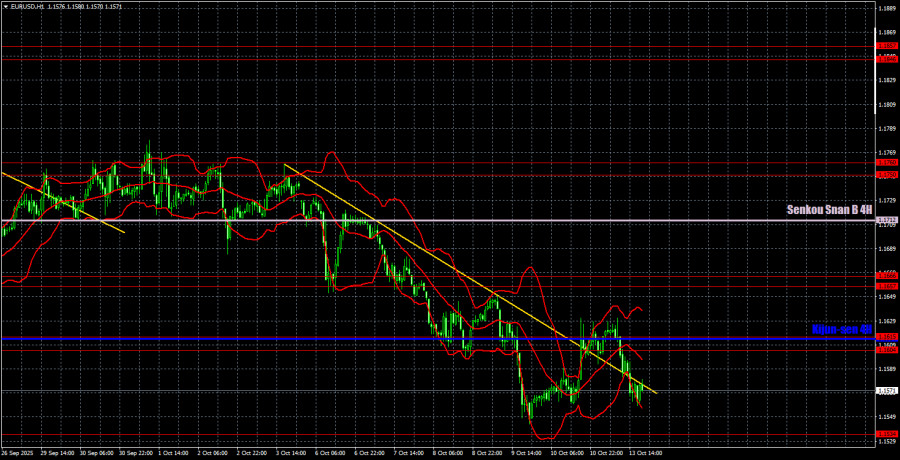
On the hourly timeframe, EUR/USD may have completed its downward trend last week. The trendline has been broken, and now the euro needs to consolidate above the Kijun-sen line. If it does, we can expect further upside—at least up to the Senkou Span B line. We believe the euro has long been overdue for a stronger rally.
On October 14, we highlight the following levels for trading: 1.1234, 1.1274, 1.1362, 1.1426, 1.1534, 1.1604-1.1615, 1.1657-1.1666, 1.1750-1.1760, 1.1846-1.1857, 1.1922, 1.1971-1.1988, as well as the Senkou Span B (1.1712) and Kijun-sen (1.1614) lines. The Ichimoku indicator lines may move during the day, which should be taken into account when determining trading signals. Do not forget to place a stop-loss order at breakeven if the price has moved 15 pips in the right direction. This will protect you from possible losses if the signal turns out to be false.
On Tuesday, Germany will publish final inflation data for September and the ZEW Economic Sentiment Index. However, all three reports are considered secondary, and any market reaction is expected to be mild. Later in the day, Jerome Powell is scheduled to speak, though no major remarks are anticipated at this time.
On Tuesday, traders can trade within the 1.1604–1.1615 area and from the 1.1534 level. A confirmed breakout above the Kijun-sen line is now required to initiate a sustained uptrend. Otherwise, the dollar may continue its unjustified rise.

HIZLI BAĞLANTILAR
show error
Unable to load the requested language file: language/turkish/cookies_lang.php
date: 2025-10-14 09:59:09 IP: 216.73.216.208


 Bize Ulaşın

