The GBP/USD pair continued its upward movement throughout Thursday. Yesterday, the Bank of England narrowly voted to cut its key interest rate — a move that should have triggered a decline in the British currency. However, the market was mentally prepared for such a decision. What it wasn't prepared for was the fact that only five out of nine members of the Monetary Policy Committee voted in favor of the rate cut. The voting results revealed that the BoE's true stance is far less dovish than traders and analysts had expected.
In our view, the BoE should not have implemented monetary easing in August at all, as inflation in the UK has been rising for over a year, now exceeding the Bank's target by nearly twofold. Moreover, the state of the economy and labor market is not so dire as to justify a rate cut at this moment. In any case, the more important factors remain U.S.-related, and based on them, the dollar may continue to weaken against its major peers for quite some time.
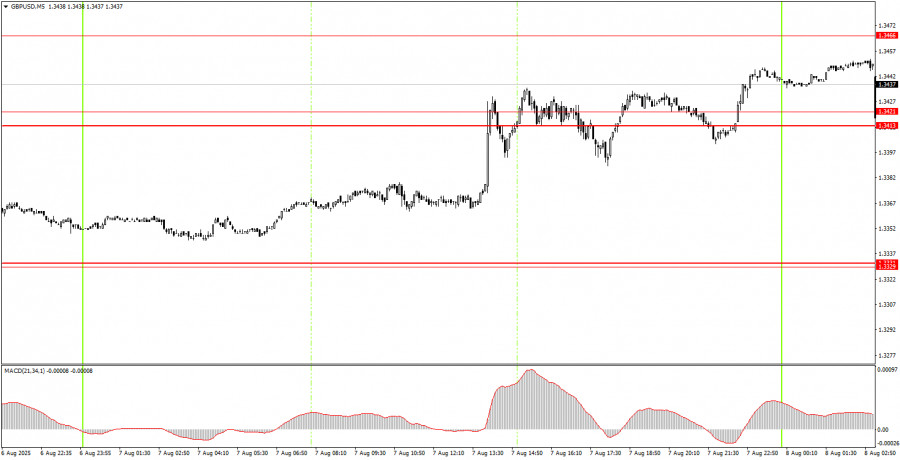
In the 5-minute time frame, numerous trading signals were generated on Thursday, but all of them occurred after the BoE's meeting, during a period of market chaos. After such major events as central bank meetings, volatility always spikes, and price action tends to be erratic. Therefore, only very clear signals should be considered after such events — and there were none yesterday.
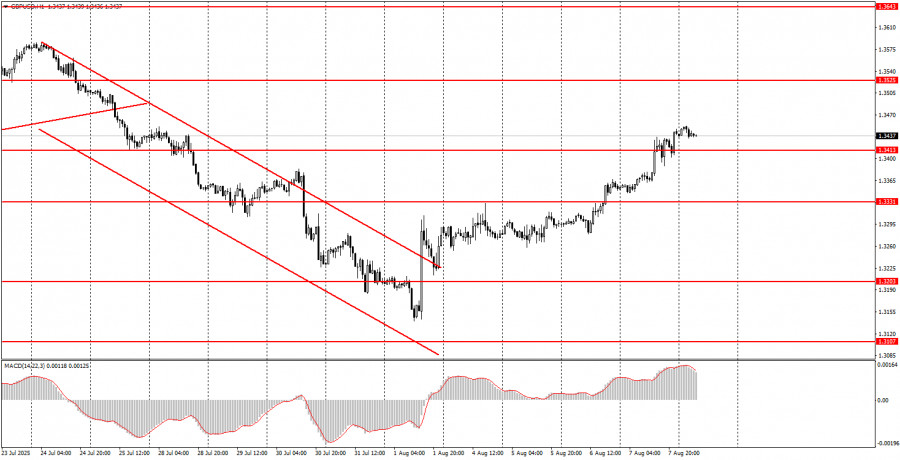
On the hourly chart, the GBP/USD pair is showing signs that the downtrend has ended. Following last Friday's news, we wouldn't bet a penny on the dollar's growth. While the market is not rushing into new dollar sell-offs, the U.S. currency continues to fall steadily almost every day. The breakout above the descending channel has been confirmed, indicating that the trend on the hourly chart has turned bullish.
On Friday, GBP/USD may continue its upward movement. Therefore, any support level becomes a potential point for a rebound and further northward momentum. Since few news releases are expected today, a bounce from the 1.3413–1.3421 area could trigger another bullish wave. A breakdown below this area, on the other hand, may initiate a correction.
On the 5-minute chart, the following levels can be used for trading today: 1.3102–1.3107, 1.3203–1.3211, 1.3259, 1.3329–1.3331, 1.3413–1.3421, 1.3466, 1.3518–1.3532, 1.3574–1.3590, 1.3643–1.3652, 1.3682, 1.3763.
No important events or reports are scheduled in the UK or the U.S. on Friday, so volatility may be low and price movements weak.
Support and Resistance Levels: These are target levels for opening or closing positions and can also serve as points for placing Take Profit orders.
Red Lines: Channels or trendlines indicating the current trend and the preferred direction for trading.
MACD Indicator (14,22,3): A histogram and signal line used as a supplementary source of trading signals.
Important Events and Reports: Found in the economic calendar, these can heavily influence price movements. Exercise caution or exit the market during their release to avoid sharp reversals.
Forex trading beginners should remember that not every trade will be profitable. Developing a clear strategy and practicing proper money management are essential for long-term trading success.

LINKS RÁPIDOS


 Contate-nos

