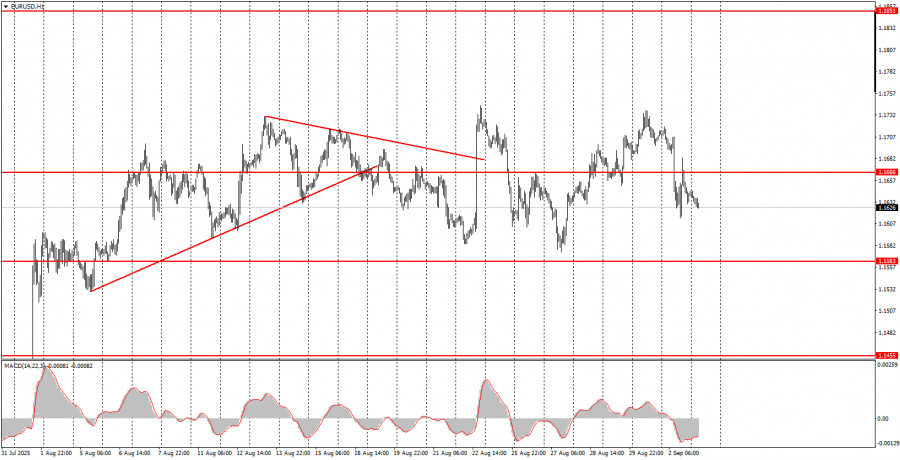
On Tuesday, the EUR/USD currency pair exhibited a movement that remains difficult to explain, even as of Wednesday. The first thing to note is that, even after the collapse of the European currency, the technical picture did not change. We intentionally zoomed out the H1 chart so that the movement of the past few weeks would fit entirely in the illustration. Thanks to this, it is clearly visible that the flat remains. That is, for 2.5 weeks, the pair has been trading strictly sideways, and what happened in the market (or in the world) yesterday is still unclear or simply unknown. Clearly, the market was not selling the pair based on the EU inflation reports or US business activity. The inflation data was published an hour after the drop began. The report itself suggested euro growth, not a decline, since EU inflation accelerated above forecasts. The US ISM Manufacturing Index came in weaker than expected, which should have put pressure on the dollar. But the dollar rose for most of the day.
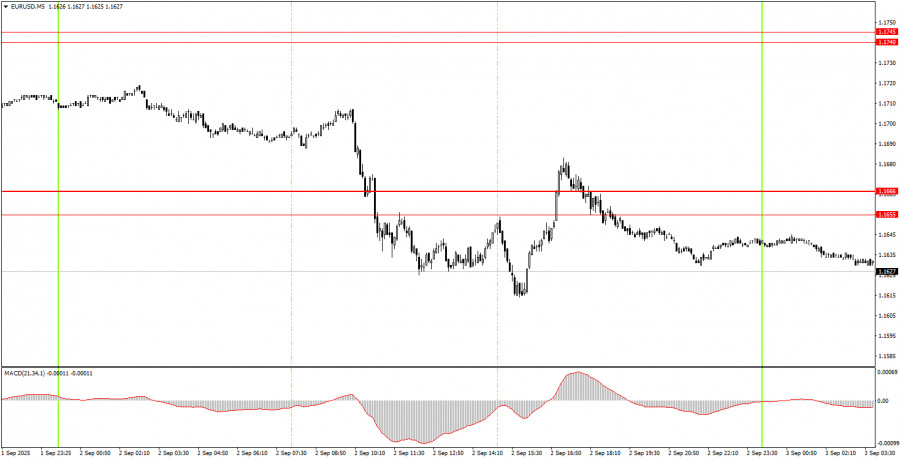
On the 5-minute timeframe on Tuesday, several trading signals were formed, but we did not even bother to mark them on the illustration. When the first sell signal formed in the 1.1655-1.1666 area, it was already clear that "something inexplicable" had happened. Thus, after 2.5 weeks of weak volatility, such a sharp move should have—at the very least—caused concern and doubts. We believe that novice traders should have taken none of Tuesday's trading signals.
On the hourly timeframe, the EUR/USD pair still has every chance to continue the uptrend that has been forming since the start of this year, but for now, a flat is still being observed. The fundamental and macroeconomic background remains poor for the US dollar. In our view, as before, the US currency can only hope for technical corrections.
On Wednesday, the EUR/USD pair could trade in either direction, as Tuesday saw highly emotional price moves not triggered by macroeconomic news. Trading today can be done from the 1.1655-1.1666 area, but you need to make sure the market has calmed down.
On the 5-minute timeframe, consider the levels: 1.1198-1.1218, 1.1267-1.1292, 1.1354-1.1363, 1.1413, 1.1455-1.1474, 1.1527, 1.1552-1.1563-1.1571, 1.1655-1.1666, 1.1740-1.1745, 1.1808, 1.1851, 1.1908. On Wednesday, ECB President Christine Lagarde will give another speech in the Eurozone, and the US will release the JOLTS Job Openings report for July. Both events may easily be ignored by the market, but could also trigger a minor reaction.
Support and Resistance Levels: These are target levels for opening or closing positions and can also serve as points for placing Take Profit orders.
Red Lines: Channels or trendlines indicating the current trend and the preferred direction for trading.
MACD Indicator (14,22,3): A histogram and signal line used as a supplementary source of trading signals.
Important Events and Reports: Found in the economic calendar, these can heavily influence price movements. Exercise caution or exit the market during their release to avoid sharp reversals.
Forex trading beginners should remember that not every trade will be profitable. Developing a clear strategy and practicing proper money management are essential for long-term trading success.

QUICK LINKS


 Contact Us

