The GBP/USD currency pair also showed a very unimpressive movement on Friday and is also in a horizontal channel. However this channel is much wider than the one for the euro, which can be limited by the levels 1.1760 and 1.1974. Therefore, this means that the pound is also in a flat, just not as deep as the euro. The UK published its retail sales report on Friday, which was slightly above the forecasts in October. However, traders were not very happy about it. The pound literally stood in one place all day long. The upward trend formally remains. Formally, because the flat can last a week or two or even three, and sooner or later the price will go below the trend line. And it will not be considered as a signal to sell because in a flat practically all the trend indicators stop giving strong and correct signals. From a technical point of view, the pound retains good chances of rising, but from a fundamental point of view, there is no reason to grow.
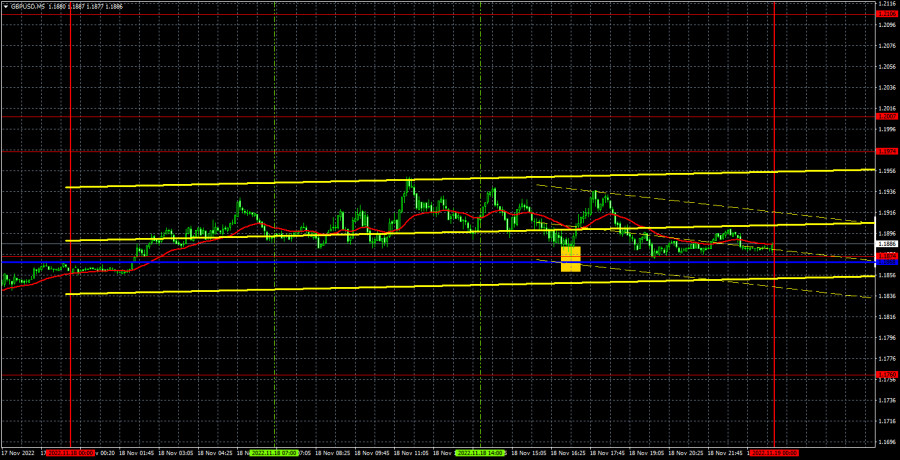
Trading signals for the pound were also as simple as possible, because there was only one signal for the entire day, and it was unambiguous. The price bounced from the level of 1.1874 at the US trading session, afterwards it managed to go up by 45 points. Traders could get profit in case they manually closed their position.
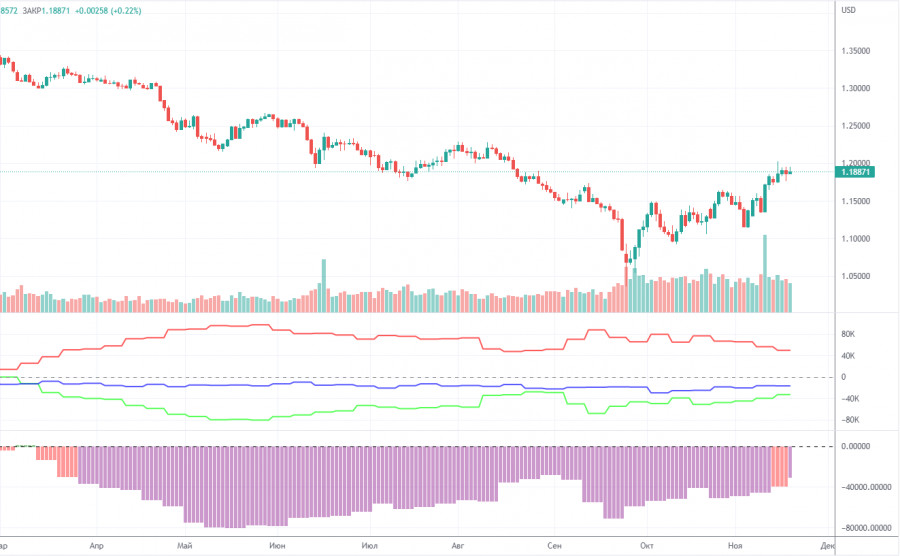
The latest Commitment of Traders (COT) report on GBP logged a slight decrease in bearish sentiment. In the given period, the non-commercial group closed 1,900 long positions and 11,500 short positions. Thus, the net position of non-commercial traders increased by 3,000, which is very small for the pound. The net position is gradually growing during the last months, but the mood of the big players is still bearish. The pound has been rising in recent weeks, but so far it does not seem that it is preparing for a long-term uptrend. And, if we remember the euro's situation, then based on the COT reports, we can hardly expect a surge in price. The demand for the US currency remains very high, and the market, as it seems, is just waiting for the new geopolitical shocks in order to return to buying the dollar. The non-commercial group now has a total of 67,000 shorts and 34,000 longs opened. As we can see, there is a wide gap between them. As it turns out the euro is now unable to show growth when market sentiment is bullish. When it comes to the total number of long and short positions, here bulls have an advantage of 17,000. Still, this is not enough for the sterling to increase. Anyway, we are still skeptical about the pound's long-term growth although the technical picture shows otherwise.
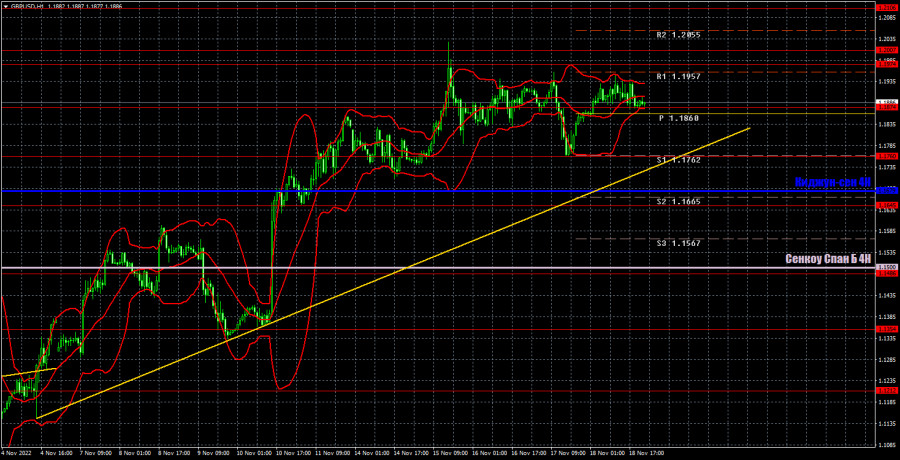
The pound/dollar pair started a long-awaited correction on the one-hour chart, but so far it is weak, and the entire movement of the past week has been more like a flat. We believe that the pound's growth in the last few weeks was unjustified, so we expect a stronger downward correction. However the price may spend some time in the horizontal channel of 1.1760-1.1974. On Monday, the pair may trade at the following levels: 1.1486, 1.1645, 1.1760, 1.1874, 1.1974-1.2007, 1.2106, 1.2185, 1.2259. The Senkou Span B (1.1500) and Kijun Sen (1.1679) lines may also generate signals. Pullbacks and breakouts through these lines may produce signals as well. A Stop Loss order should be set at the breakeven point after the price passes 20 pips in the right direction. Ichimoku indicator lines may move during the day, which should be taken into account when determining trading signals. In addition, the chart does illustrate support and resistance levels, which could be used to lock in profits. Important reports and events are not scheduled for today in the UK and USA. Therefore, most likely, the pair will remain inside the horizontal channel we mentioned above.
Price levels of support and resistance are thick red lines, near which the movement may end. They do not provide trading signals.
The Kijun-sen and Senkou Span B lines are the lines of the Ichimoku indicator, moved to the one-hour chart from the 4-hour one. They are strong lines.
Extreme levels are thin red lines from which the price bounced earlier. They provide trading signals.
Yellow lines are trend lines, trend channels, and any other technical patterns.
Indicator 1 on the COT charts reflects the net position size of each category of traders.
Indicator 2 on the COT charts reflects the net position size for the non-commercial group.

ĐƯỜNG DẪN NHANH


 Liên hệ chúng tôi

