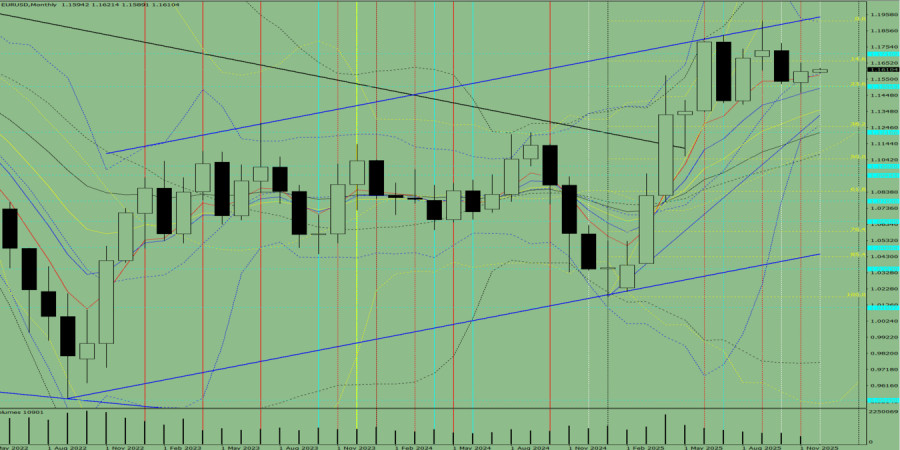
In December, from the level of 1.1598 (the close of the November monthly candle), the price may begin moving downward toward 1.1252 — the 38.2% retracement level (yellow dashed line). From this level, the market may show a corrective upward move toward 1.1315 — the support line (thin blue line).
Fig. 1 (Monthly Chart).
Conclusion from comprehensive analysis: a downward trend is possible.
The price will most likely show a downward tendency, with the monthly bearish candle lacking the first upper shadow (first week of the month — bearish) and having the second lower shadow (last week of the month — bullish).
From the level of 1.1598 (the close of the November monthly candle), the price may continue moving downward toward 1.1391 — the lower fractal (monthly candle of August 1, 2025). From this level, the market may move upward toward 1.1506 — the 23.6% retracement level (yellow dashed line).

HIZLI BAĞLANTILAR
show error
Unable to load the requested language file: language/turkish/cookies_lang.php
date: 2025-12-03 03:48:32 IP: 216.73.216.131


 Bize Ulaşın

