Akcie společnosti Halozyme Therapeutics klesly o 16 %, když analytik David Risinger z Leerink Partners snížil doporučení z „Market Perform“ na „Underperform“ a zároveň snížil cílovou cenu z 63 na 47 dolarů. Důvodem jsou obavy z dopadů návrhu pravidel CMS ohledně zákona o snižování inflace (IRA), který může ovlivnit cenovou ochranu léčiv.
Přestože Halozyme zveřejnila obecně pozitivní výsledky za první čtvrtletí, investoři zareagovali na riziko, že její kombinované produkty s hyaluronidázou mohou podléhat vyjednávání o cenách dříve, než se očekávalo. Nový návrh CMS totiž naznačuje, že se vyjednávání může spustit 13 let od schválení původní účinné látky, nikoliv až od schválení kombinovaného léku.
Risinger uvedl, že snižuje diskontní sazbu z 8 % na 12 % a odhad budoucího růstu z -15 % na -25 %. Podle něj návrh CMS výrazně zvyšuje riziko dřívějších cenových tlaků na produkty Halozyme. Přesto zatím nedošlo ke změnám v odhadech příjmů – konečné znění se očekává ve druhé polovině roku 2025.
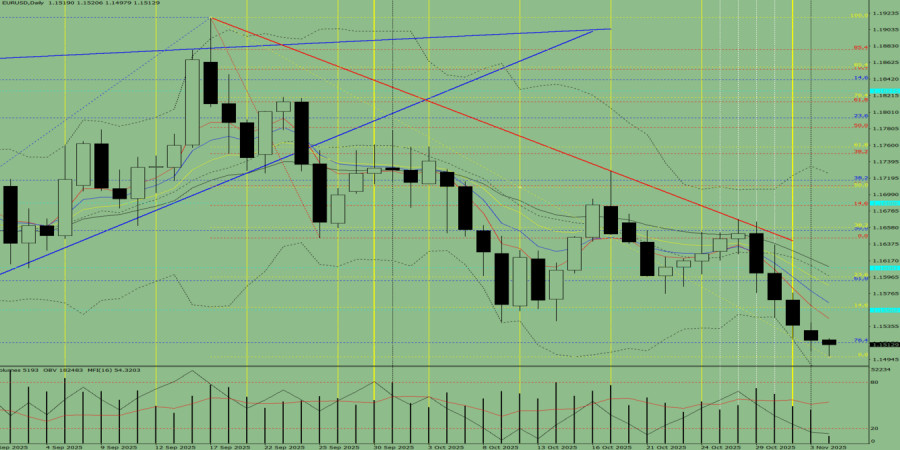
Fig. 1 (Daily Chart).
Comprehensive Analysis:
Overall conclusion: Upward trend.
Alternative scenario: From the level of 1.1518 (the close of yesterday's daily candle), the price may begin moving upward toward the target of 1.1545 — the 5-period EMA (thin red line). Upon testing this line, the price may possibly pull back downward toward 1.1515 — the 76.4% retracement level (blue dashed line).

HIZLI BAĞLANTILAR
show error
Unable to load the requested language file: language/turkish/cookies_lang.php
date: 2025-11-04 07:03:05 IP: 216.73.216.81


 Bize Ulaşın

