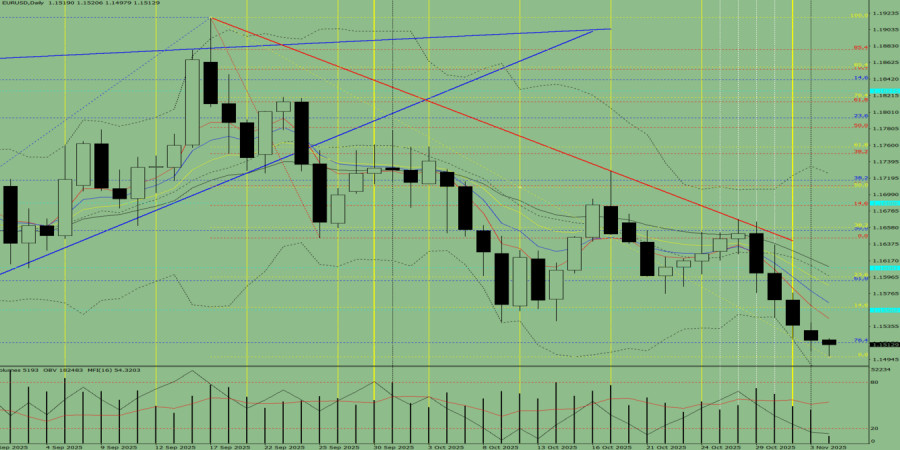
Trend Analysis (Fig. 1).On Tuesday, the market from the level of 1.1518 (the close of yesterday's daily candle) may begin moving upward toward the target of 1.1560 — the 14.6% retracement level (yellow dashed line). When testing this level, the price may possibly pull back downward toward the 5-period EMA — 1.1545 (thin red line).

Fig. 1 (Daily Chart).
Comprehensive Analysis:
- Indicator analysis – upward;
- Volume – upward;
- Candlestick analysis – upward;
- Trend analysis – upward;
- Bollinger Bands – upward;
- Weekly chart – upward.
Overall conclusion: Upward trend.
Alternative scenario: From the level of 1.1518 (the close of yesterday's daily candle), the price may begin moving upward toward the target of 1.1545 — the 5-period EMA (thin red line). Upon testing this line, the price may possibly pull back downward toward 1.1515 — the 76.4% retracement level (blue dashed line).


 Contact Us

