Švédské akcie se v pondělí po uzavření obchodování snížily, když ztráty v sektorech průmyslových podniků, financí a základních materiálů vedly k poklesu akcií.
Na konci obchodování ve Stockholmu ztratil index OMX Stockholm 30 0,39 %.
Nejlépe se v rámci indexu OMX Stockholm 30 dařilo společnosti Tele2 AB (ST:TEL2b), která vzrostla o 2,29 %, tj. o 2,85 bodu, a v závěru se obchodovala na úrovni 127,35 bodu. Mezitím společnost Essity AB B (ST:ESSITYb) přidala 2,02 %, tj. 5,80 bodu, a skončila na 293,40 bodu a společnost Telia Company AB (ST:TELIA) si v závěru obchodování připsala 1,88 %, tj. 0,64 bodu, na 34,70 bodu.
Nejhůře si během seance vedla společnost ABB Ltd. (ST:ABB), která klesla o 4,37 % neboli 27,00 bodu a v závěru obchodování se obchodovala na úrovni 591,40 bodu. Electrolux AB Class B (ST:ELUXb) klesl o 1,63 %, resp. 1,60 bodu, a zakončil na úrovni 94,00 bodu a Hexagon AB ser. B (ST:HEXAb) se snížil o 1,58 % neboli 2,00 bodu na 124,90 bodu.
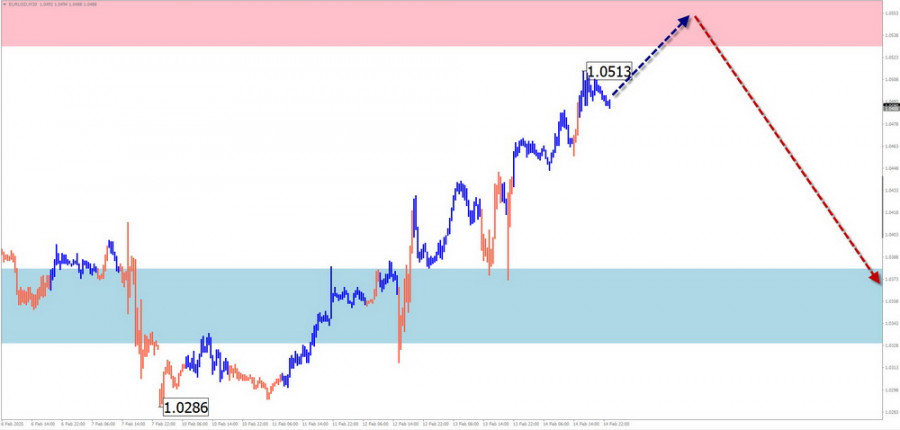
Analysis:The downtrend that began in late summer last year is nearing completion. Since February 3, a counter-trend bullish wave has been forming, signaling a potential reversal. Currently, the price is near the lower boundary of a strong potential reversal zone.
Forecast:At the start of the week, the euro is likely to maintain its bullish momentum, potentially testing the resistance zone and briefly exceeding its upper boundary. However, a trend reversal and renewed decline toward support levels are expected in the second half of the week.
Potential Reversal Zones:
Recommendations:
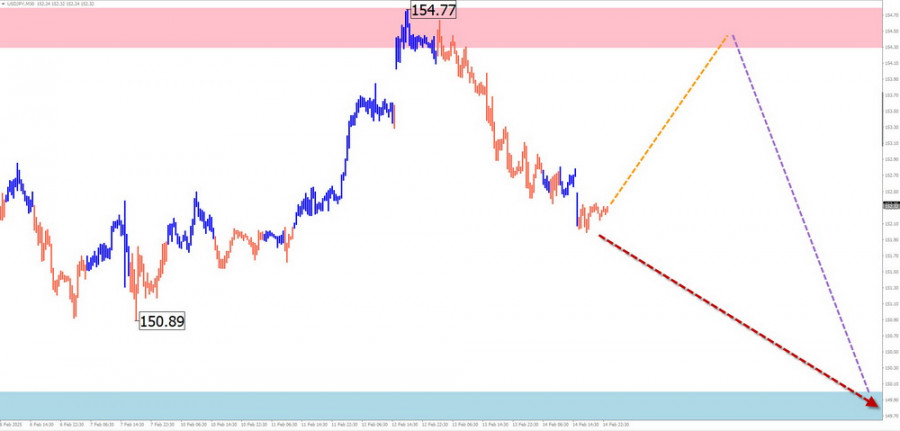
USD/JPY
Analysis:Since late last year, the pair has been following a downward wave structure. Over the past two weeks, prices have been correcting, forming a corrective flat pattern, which is nearing completion. The estimated support level is at the upper boundary of a major potential reversal zone on a higher timeframe.
Forecast:In the coming days, sideways movement and mild upward price action are expected. Near the resistance area, the pair may enter a consolidation phase, forming a reversal. By the weekend, a decline toward support levels is likely.
Potential Reversal Zones:
Recommendations:
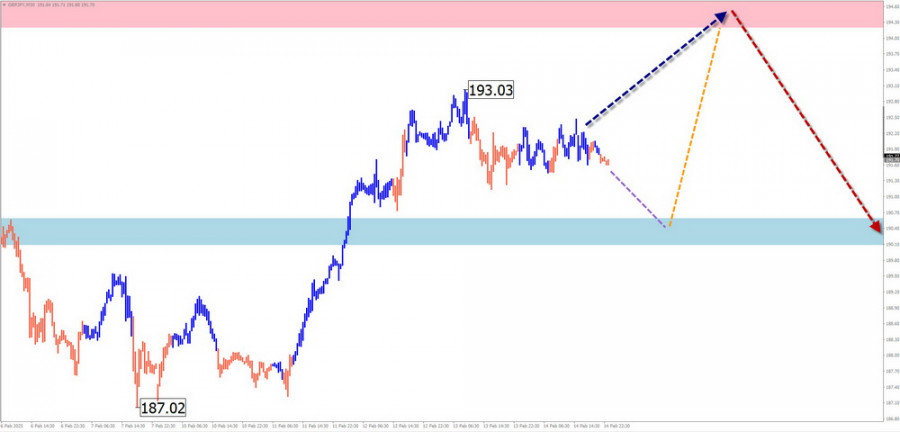
GBP/JPY
Analysis:The current downward wave structure of the GBP/JPY pair has been developing since December. Over the past month, an ongoing complex correction has formed. Prices are now approaching the lower boundary of a strong weekly resistance zone.
Forecast:The pair is expected to trade between key support and resistance zones throughout the week. A test of resistance may trigger a reversal, followed by a downward move toward support in the second half of the week.
Potential Reversal Zones:
Recommendations:
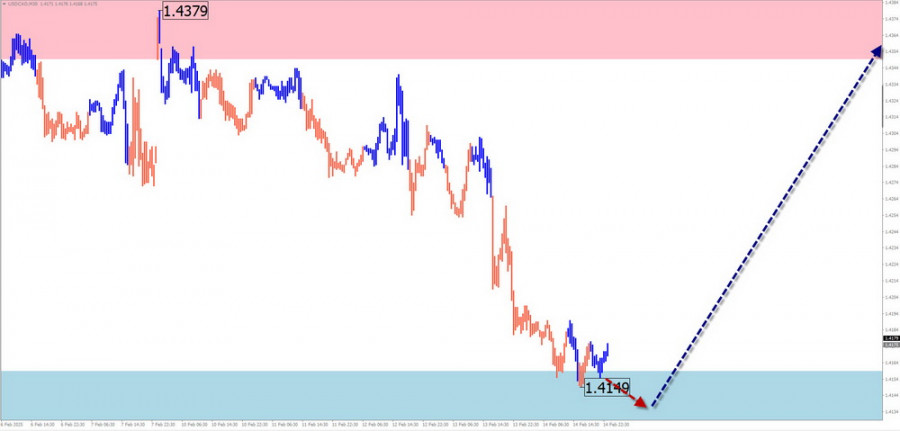
USD/CAD
Analysis:The uptrend in USD/CAD dominated the short-term trend until early February. Since then, a downward wave with strong reversal potential has been developing. Over the past week, a corrective move has formed, which is expected to complete before resuming the decline.
Forecast:The pair is likely to trade sideways throughout the week. At the beginning of the week, support levels may be tested, potentially breaking below them briefly before a bullish reversal towards resistance. A trend shift is likely at the end of this week or early next week.
Potential Reversal Zones:
Recommendations:
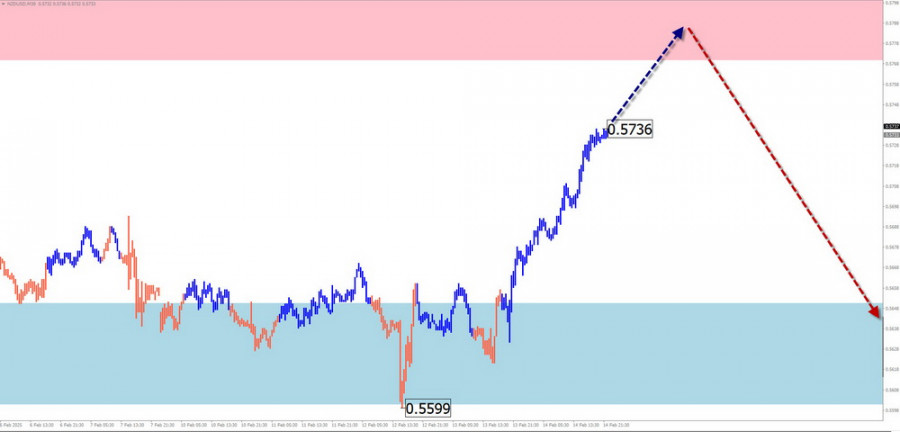
NZD/USD
Analysis:Since last summer, NZD/USD has been in a downtrend, forming a descending wave pattern. Since late December, a corrective wave (B) has been developing. Price extremes form an extended flat pattern, which remains incomplete.
Forecast:The upward movement may continue early next week, likely reaching the resistance zone. A sideways phase and subsequent reversal are expected. Declines may resume towards the weekend.
Potential Reversal Zones:
Recommendations:
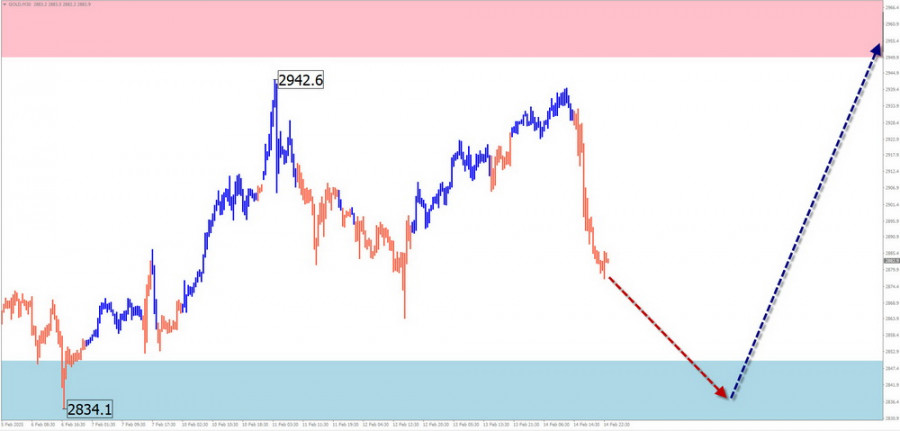
GOLD (XAU/USD)
Analysis:The bullish trend in gold continues. The last incomplete wave segment since November 14 does not yet show signs of completion. Recent sideways movement remains within the correction phase of the larger trend. Gold prices are drifting between potential reversal zones of varying scales.
Forecast:Gold may decline toward support zones in the coming days, forming a reversal pattern. Price recovery and renewed bullish momentum are expected in the second half of the week.
Potential Reversal Zones:
Recommendations:
Explanation of Simplified Wave Analysis (SWA)

HIZLI BAĞLANTILAR
show error
Unable to load the requested language file: language/turkish/cookies_lang.php
date: 2025-07-17 11:14:50 IP: 216.73.216.4


 Bize Ulaşın

