Scheduled Maintenance
Scheduled maintenance will be performed on the server in the near future.
We apologize in advance if the site becomes temporarily unavailable.
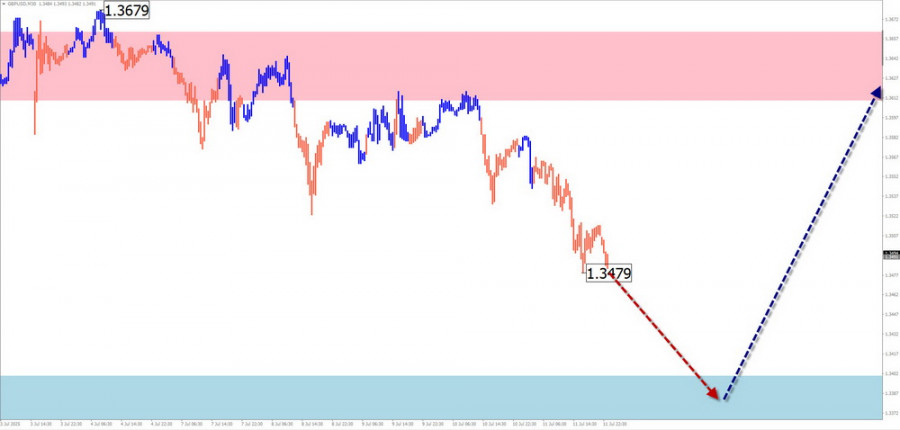
.GBP/USD
Analysis:
The upward wave that began in January of this year has entered a corrective phase. Since the end of last month, quotes have been pulling back from the lower boundary of a strong potential reversal zone. The calculated support lies at the upper boundary of the 4-hour time frame's support zone.
Forecast:
Sideways movement is expected throughout the week. The early part of the week may see a downward trend toward support. Afterward, a reversal and an upward move are possible. Volatility may rise significantly toward the weekend.
Potential Reversal Zones
Resistance: 1.3610 / 1.3660Support: 1.3400 / 1.3350
Recommendations:
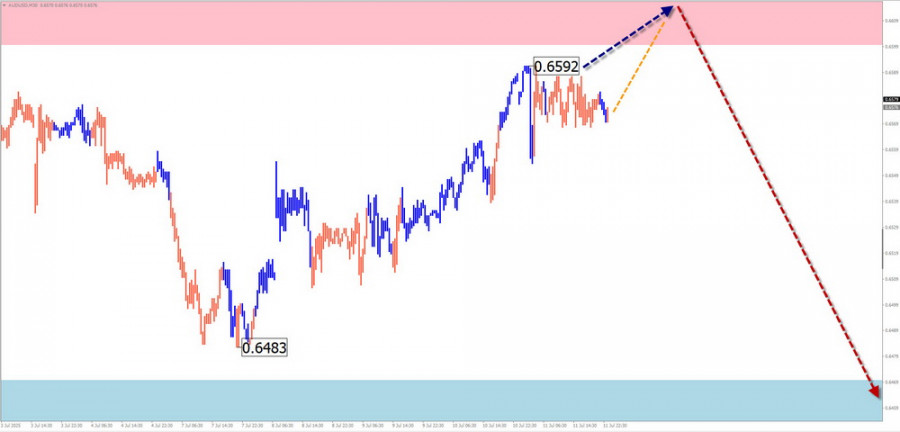
AUD/USD
Analysis:
The unfinished bullish wave from early April continues to dominate the trend on the Australian dollar chart. Since June 23, the final leg of this wave has been forming. As of the analysis, the pair is near the lower boundary of a broad potential reversal zone on the daily time frame.
Forecast:
A bullish trend is expected in the coming days, with potential pressure on the upper boundary of the resistance zone. After reaching this area, a reversal may occur, followed by a bearish phase.
Potential Reversal Zones
Resistance: 0.6600 / 0.6650Support: 0.6470 / 0.6420
Recommendations:
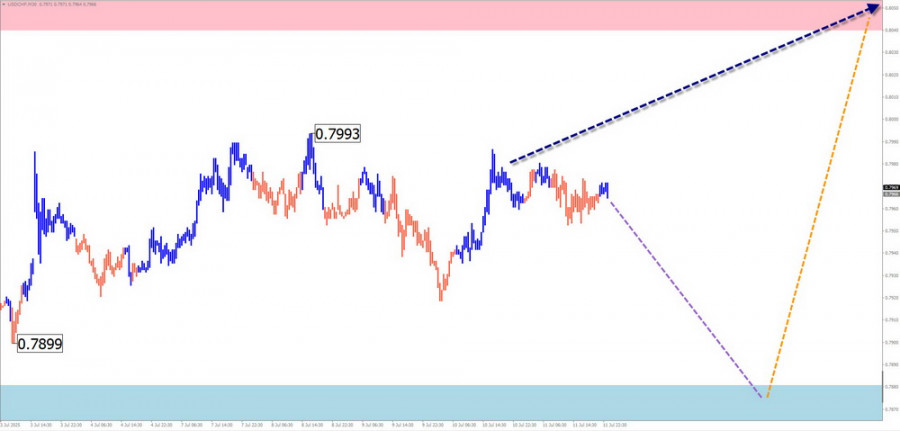
USD/CHF
Analysis:
The downward trend that began early this year continues to guide the USD/CHF pair. A corrective (B) wave has formed in recent months, developing as a flattening structure. The final leg is still missing. Price has been moving sideways near the upper boundary of the weekly support zone.
Forecast:
Sideways movement is expected at the beginning of the week. A brief decline toward the support zone is possible. Afterward, a reversal and a bullish trend may begin. The highest market activity is likely near the end of the week.
Potential Reversal Zones
Resistance: 0.8040 / 0.8090Support: 0.7880 / 0.7830
Recommendations:
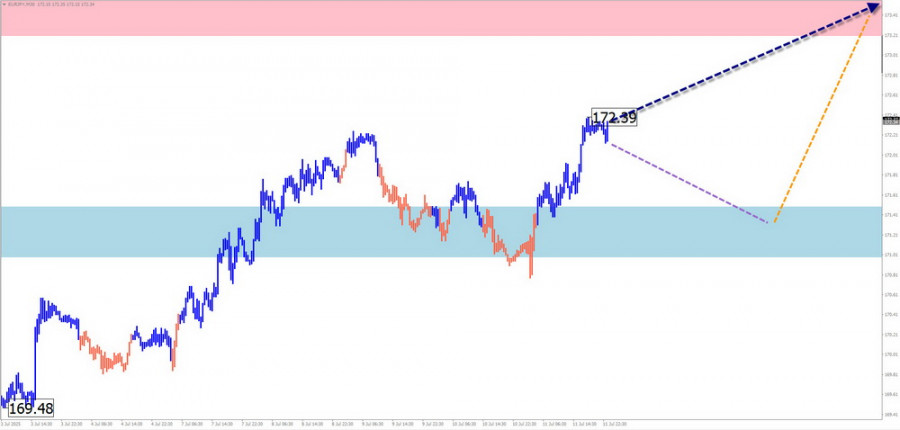
EUR/JPY
Analysis:
An upward wave zigzag has been developing since August of last year. The unfinished segment of the wave has been active since mid-May. Last week, the pair approached a potential reversal zone on the hourly chart. The resulting pullback remains within the bounds of a temporary correction.
Forecast:
Sideways movement is expected to continue. In the next few days, the pair may decline toward support. A reversal and renewed upward movement are possible closer to the weekend.
Potential Reversal Zones
Resistance: 173.20 / 173.70
Support: 171.50 / 171.00
Recommendations:
AUD/JPY
Analysis:
The ongoing upward wave of the AUD/JPY pair, which began on August 5 of last year, is forming as a flattening structure. The pair is currently in a cluster of potential reversal levels across different time frames. The final leg of the wave has yet to form.
Forecast:
A sideways movement is expected early in the week along the calculated support zone. This may be followed by a resumption of upward movement toward resistance. Volatility may increase closer to the weekend.
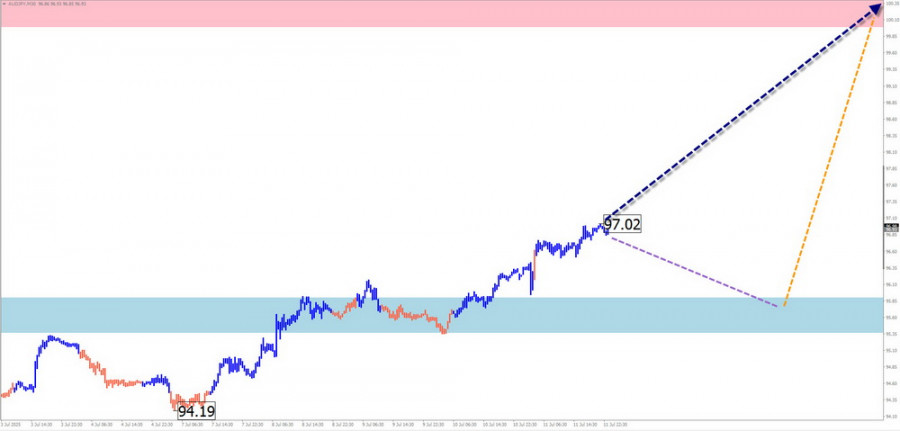
Potential Reversal Zones
Resistance: 100.00 / 100.50Support: 95.90 / 95.40
Recommendations:
US Dollar Index
Analysis:
The correction of the main bearish wave has brought the US Dollar Index to a broad potential reversal zone on the 4-hour chart. As of the analysis, the wave structure appears unfinished. The calculated resistance runs along the upper boundary of the reversal zone.
Forecast:
A change in direction is expected this week. Once the upward phase ends near resistance, the index may reverse and resume a downward move. The highest volatility and activity are likely near the end of the week.
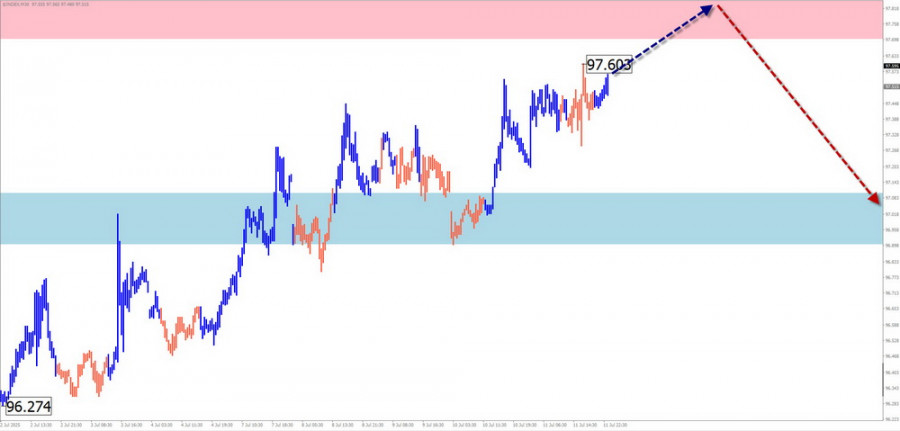
Potential Reversal Zones
Resistance: 97.90 / 98.10Support: 97.10 / 96.90
Recommendations:The period of US dollar strength is nearing its end. During the upcoming week, it is advisable to close short positions on national currencies and begin monitoring opportunities to buy them in major pairs.
Note: In simplified wave analysis (SWA), all waves consist of 3 parts (A-B-C). Each time frame analyzes the most recent unfinished wave. Dotted lines represent expected movements.
Caution: The wave algorithm does not account for the duration of price movements over time.
Scheduled maintenance will be performed on the server in the near future.
We apologize in advance if the site becomes temporarily unavailable.

RÁPIDOS ENLACES


 Contáctenos