The EUR/USD currency pair did not show increased volatility on Tuesday, and market interest was limited. Overall, the movement in recent months has been sideways. In the last few days, we have dealt with another local sideways range visible on the hourly timeframe. Thus, the market has been forced to trade in two sideways channels over the last few days. Of course, after yesterday's release of American data, volatility increased slightly, but nothing significant has changed in the market. The pair needs upward movement—consistent growth that logically reflects all fundamental and macroeconomic events. Without this condition being met, we will continue to see "zigzags" and "fences" on the charts.
We will discuss macroeconomic data in our trading recommendation articles, but in this article, I want to highlight one very important point: the Federal Reserve is preparing for a third consecutive rate cut. Let's analyze the movement of the pair, starting from September 17, when the Fed resumed its monetary easing program. Precisely on September 17, the EUR/USD pair reached its yearly high, which coincidentally marked the highest level in three years. Since September 17, the pair has only been decreasing, and the dollar has been rising accordingly. Thus, the dollar began to strengthen precisely when the Fed resumed its monetary easing, while the European Central Bank completed its rate-cut cycle. Is this a paradox? Yes. That is why we believe the current movement is entirely illogical and unwarranted. This is also why we emphasize in every article that the global upward trend of 2025 remains intact. This is why we consistently refer to the sideways movement on the daily timeframe, as it explains what is currently happening in the market.
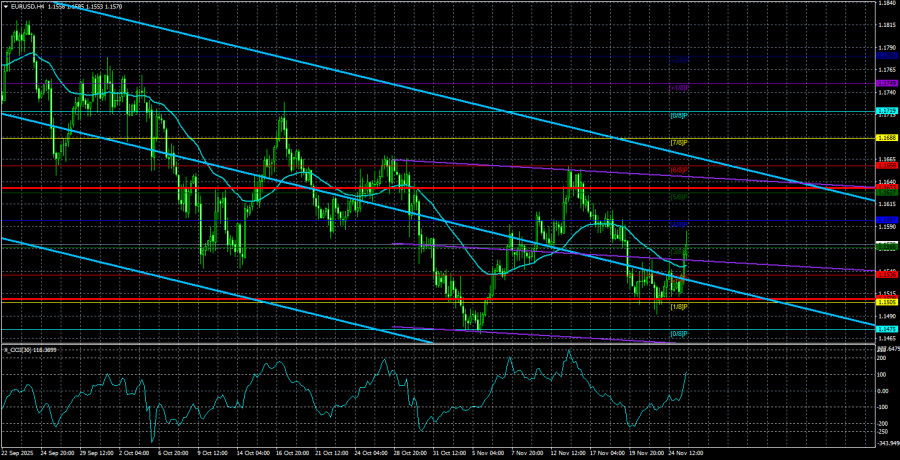
So what is the conclusion? We need to wait for the market to awaken. When the pair is within a sideways channel, the lower boundary is a good place to open trend positions. The fundamental backdrop remains sharply negative for the U.S. dollar, so we do not expect a sudden downward trend to begin. Hence, the main scenario is the completion of the sideways movement and the renewal of the upward trend. If that happens, one scenario may be realized near the lower boundary. The price may either react to the level of 1.1400 and start to rise (at least to the upper boundary of the channel at 1.1830), or it may take liquidity from the last low and then begin to rise, or it may not even reach 1.1400 and start rising. In any case, we expect only growth.
How can these scenarios be traded? Only on smaller timeframes. For example, if the trend changes on the hourly timeframe, it signals a rise. Taking liquidity to buy on the daily timeframe, confirmed on the smaller charts, signals growth.
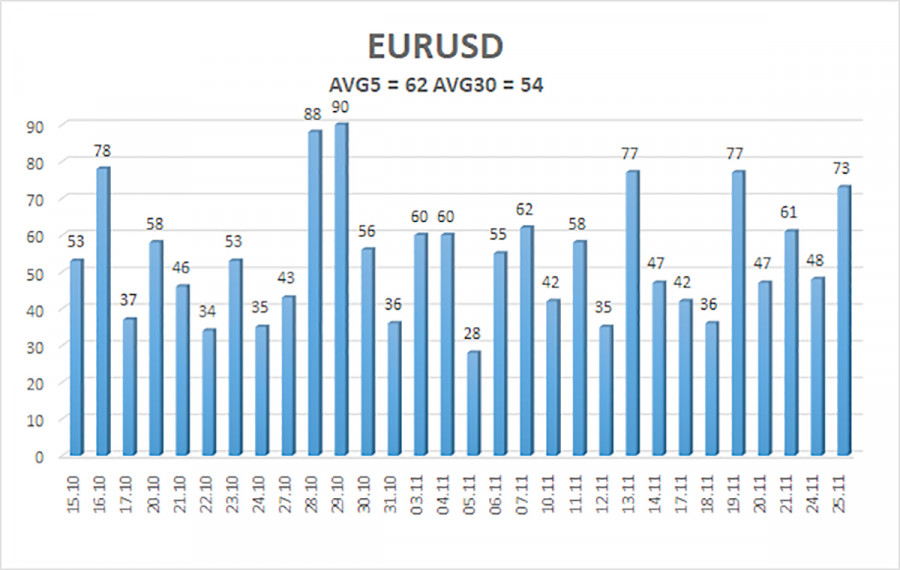
The average volatility of the EUR/USD currency pair over the last five trading days as of November 26 is 62 pips and is characterized as "medium-low." We expect the pair to move between 1.1509 and 1.1633 on Wednesday. The upper channel of the linear regression points downward, signaling a downward trend, but the market remains in a sideways range on the daily timeframe. The CCI indicator was in the oversold area twice in October, which could provoke a new wave of the upward trend in 2025.
The EUR/USD pair remains below its moving average, but an upward trend persists across all higher timeframes, while a sideways range has persisted for several months on the daily timeframe. The global fundamental backdrop continues to exert a strong influence on the U.S. dollar. Recently, the dollar has been rising, but the reasons for this movement may be purely technical. When the price is below the moving average, small short positions can be considered targeting 1.1509 on purely technical grounds. Long positions remain relevant above the moving average line with a target of 1.1800 (the upper line of the range on the daily timeframe).

SZYBKIE LINKI


 Skontaktuj się z ForexMart

