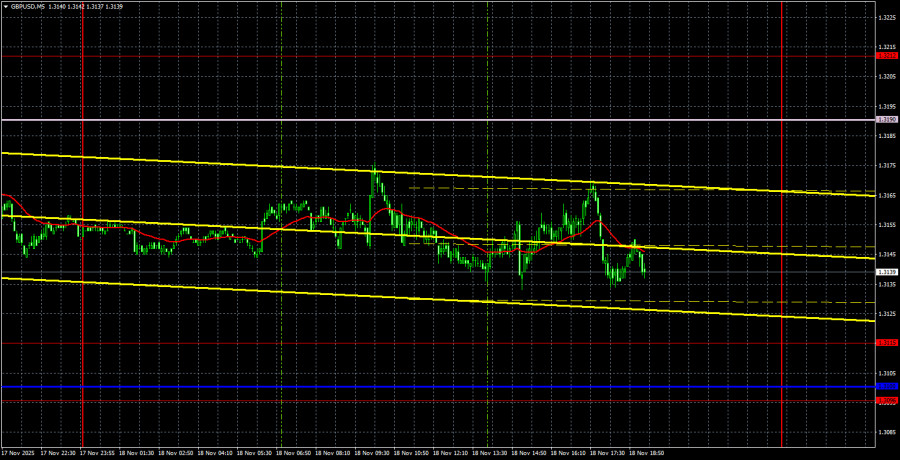
The GBP/USD currency pair traded exclusively sideways, with minimal volatility, on Tuesday. The pair remains within the sideways channel of 1.3115-1.3190 and is not even attempting to break out of it. There were no macroeconomic or fundamental events yesterday, so traders had nothing to react to throughout the day. The situation may change today, as an important inflation report will be published in the UK that could impact the Bank of England's rate decision at the next meeting. However, even this may not be enough to end the flat. The day after, the long-awaited Non-Farm Payrolls report and unemployment rates will be released in the U.S., but they may only trigger a spike in volatility and further chaos in the pair's movements. The British pound needs to consolidate above the Senkou Span B line. Without this, upward movement will not continue under any circumstances. For this to happen, inflation in the UK needs to come in higher than forecasts, while labor market and unemployment data in the U.S. need to disappoint.
On the daily timeframe, the movement's status remains corrective. We continue to await the end of the current correction, which has not aligned with fundamentals and macroeconomic factors for the past month and a half.
On the 5-minute timeframe yesterday, no trading signals were formed. The price did not even approach any levels or lines throughout the day. Thus, there were no grounds for opening trading positions.
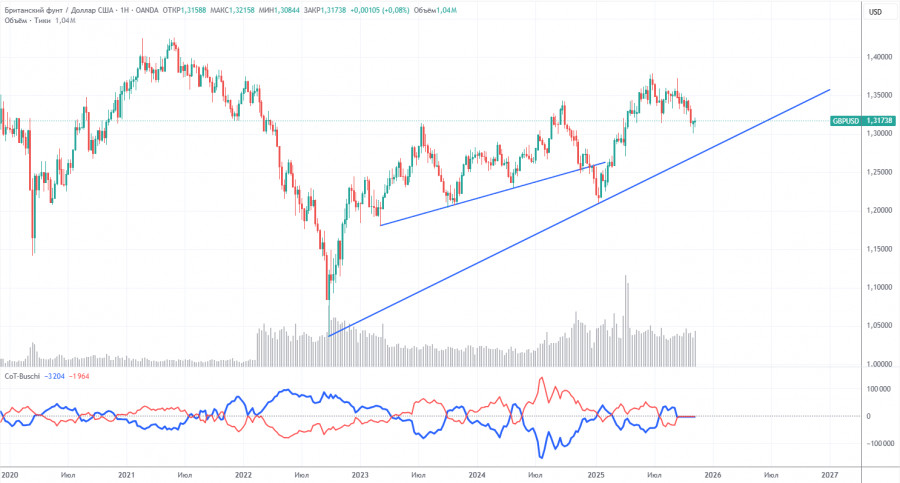
COT reports for the British pound show that commercial traders' sentiment has been changing constantly in recent years. The red and blue lines representing the net positions of commercial and non-commercial traders frequently cross each other and are mostly near the zero mark. Currently, they are at almost the same level, indicating approximately equal amounts of long and short positions.
The dollar continues to decline due to Donald Trump's policies, so market makers' demand for sterling is not particularly significant at the moment. The trade war will continue in one form or another for a long time. The Fed will, in any case, lower rates in the coming year, leading to a decline in dollar demand in one way or another. According to the latest report (dated September 23) on the British pound, the "Non-commercial" group opened 3,700 BUY contracts and closed 900 SELL contracts. Thus, the net position of non-commercial traders increased by 4,600 contracts over the week. However, this data is already outdated, and there are no new reports.
In 2025, the pound rose significantly, but one must understand that this was due to Donald Trump's policies. Once this reason is mitigated, the dollar may begin to rise, but when this will happen is anyone's guess. It does not matter how fast the net position for the pound is increasing or decreasing. The net position for the dollar is declining in any case, and it is generally declining faster.
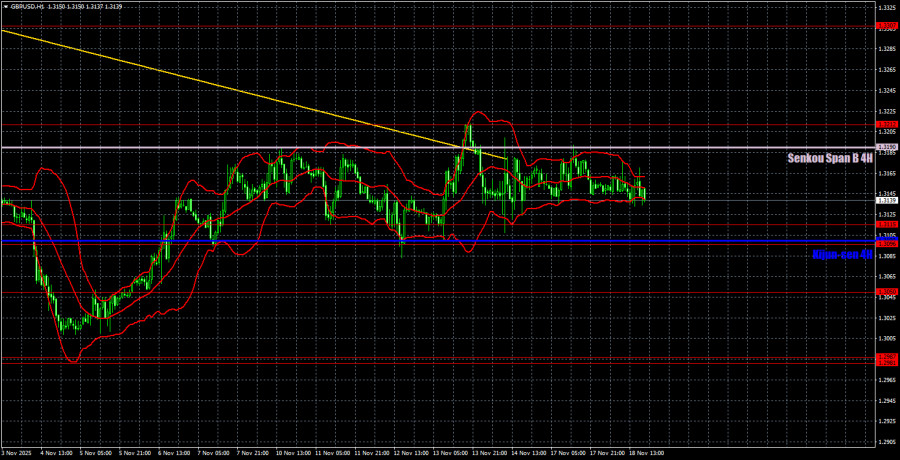
On the hourly timeframe, the GBP/USD pair has finally broken the trend line and surpassed the Senkou Span B line. It turned out to be short-lived and only led to a flat. In the coming weeks, a continuation of the British pound's growth can be expected, but it is necessary for the flow of uncontrolled negativity from the UK to cease. We still believe that medium-term growth will continue regardless of the local macroeconomic and fundamental backdrop, but for it to continue, the Senkou Span B line needs to be overcome.
For November 19, we highlight the following important levels for trading: 1.2863, 1.2981-1.2987, 1.3050, 1.3096-1.3115, 1.3212, 1.3307, 1.3369-1.3377, 1.3420, 1.3533-1.3548, and 1.3584. The Senkou Span B line (1.3190) and Kijun-sen line (1.3100) can also be sources of signals. It is recommended to set the Stop Loss level to breakeven if the price moves in the correct direction by 20 pips. The Ichimoku indicator lines may shift during the day, which should be taken into account when determining trading signals.
On Wednesday, an important inflation report is scheduled for release in the UK. We hope it triggers an exit from the sideways channel. In the evening, the minutes from the last Federal Reserve meeting will also be published, which can be considered a secondary event.
Today, traders may consider selling if the price bounces off the 1.3212 level or the Senkou Span B line, with a target at 1.3115. Long positions will become relevant if the price rebounds from the 1.3096-1.3115 area, with a target at 1.3190.

SZYBKIE LINKI


 Skontaktuj się z ForexMart

