Společnost Sartorius AG (ETR:SATG) zaznamenala v prvním čtvrtletí skokový nárůst zisku díky růstu v divizích Bioprocess Solutions a Lab Products.
Základní čistý zisk vzrostl o 21,4 % na 85 milionů eur. Základní zisk na kmenovou akcii se zvýšil na 1,22 eura z 1,01 eura v předchozím období.
Tržby vzrostly o 7,7 % na 883 milionů eur z 819,6 milionů eur o rok dříve. Na bázi konstantní měny činil nárůst 6,5 %.
Společnost Sartorius vykázala výrazný skok v ziskovosti, když základní ukazatel EBITDA vzrostl v prvním čtvrtletí o 12,2 % na 263 milionů eur. Marže EBITDA se zvýšila na 29,8 %.
Příjem zakázek rovněž předstihl tržby z prodeje, čímž se poměr zakázek k objednávkám dostal nad hodnotu jedna.
„Společnost Sartorius odstartovala nový rok velmi dobře, zejména pokračuje silný trend v oblasti spotřebního materiálu. Naopak zákazníci jsou podle očekávání stále opatrní při investicích do laboratorních přístrojů a zařízení pro bioprocesing,“ uvedl generální ředitel společnosti Sartorius Dr. Joachim Kreuzburg.
Today, the British pound was traded using the Mean Reversion strategy, while the Japanese yen could be traded using a Momentum approach.
The Eurozone Services PMI for July was revised downward, which put pressure on the euro in the first half of the day. The final index reading published by S&P Global came in at 51.0, below the preliminary estimate. This indicates a slowdown in growth in the services sector, which is a key driver of the euro area economy. While the index remains above the 50-point threshold that separates expansion from contraction, the downgrade reinforces concerns about the region's economic outlook.
Today, the U.S. ISM Services PMI, Composite PMI, and Trade Balance data are due. Strong figures could help ease concerns about a potential economic slowdown. The ISM Services PMI is a key indicator of the health of the U.S. economy. If the figure exceeds expectations, it will signal continued growth in the services sector, which is a positive development. The Composite PMI, which combines data from both manufacturing and non-manufacturing sectors, will offer a broader picture of economic activity. A positive trend would confirm the economy's resilience. The trade balance also plays a significant role: a narrowing deficit or a shift to a surplus would indicate rising exports and, in turn, domestic production growth.
If the data is strong, I will rely on Momentum strategy setups. If the market shows little reaction, I will continue using the Mean Reversion strategy.
Momentum Strategy (Breakout) for the Second Half of the Day:
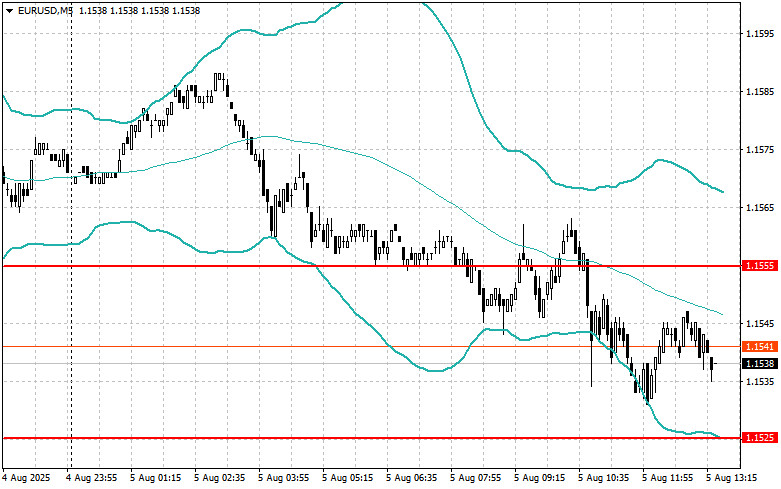
EUR/USD
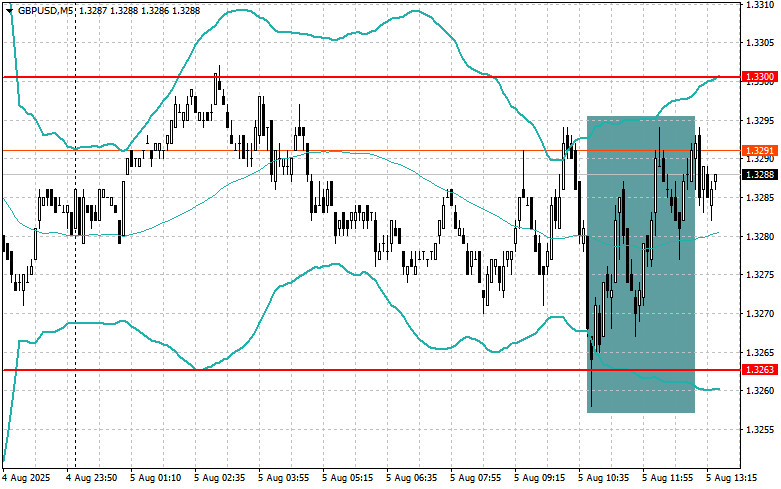
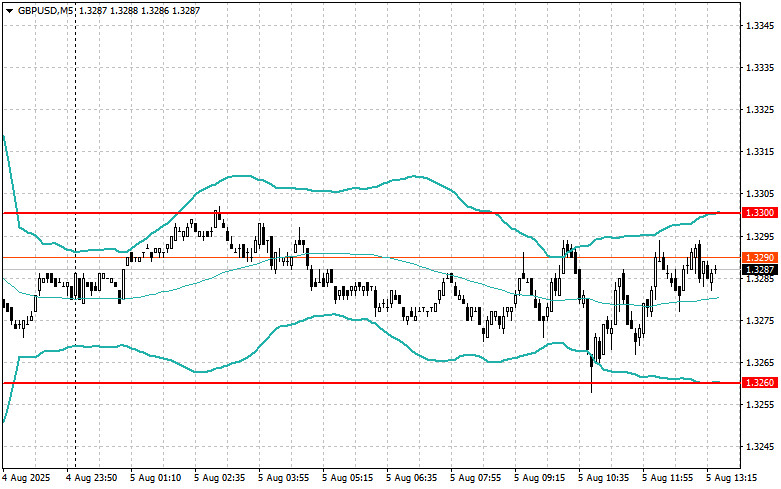
GBP/USD
USD/JPY
Mean Reversion Strategy (Pullback) for the Second Half of the Day:
EUR/USD
GBP/USD
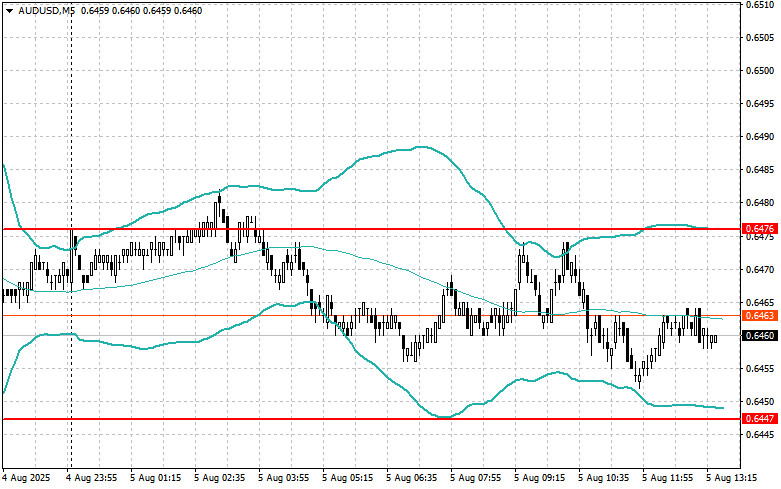
AUD/USD
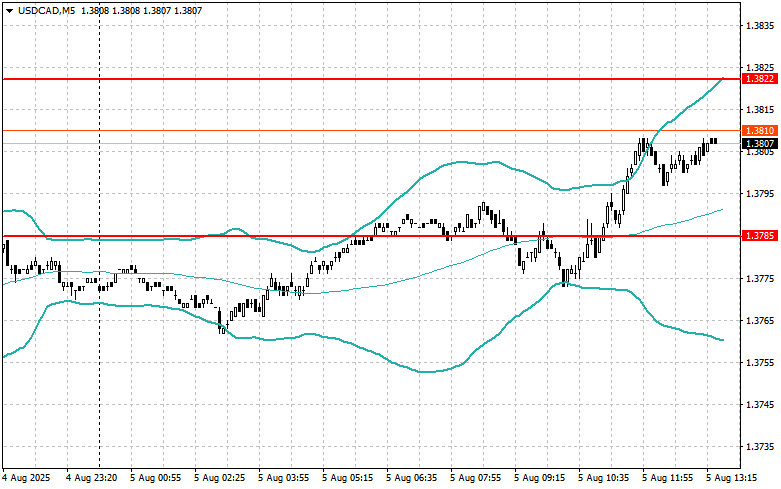
USD/CAD

SZYBKIE LINKI


 Skontaktuj się z ForexMart

