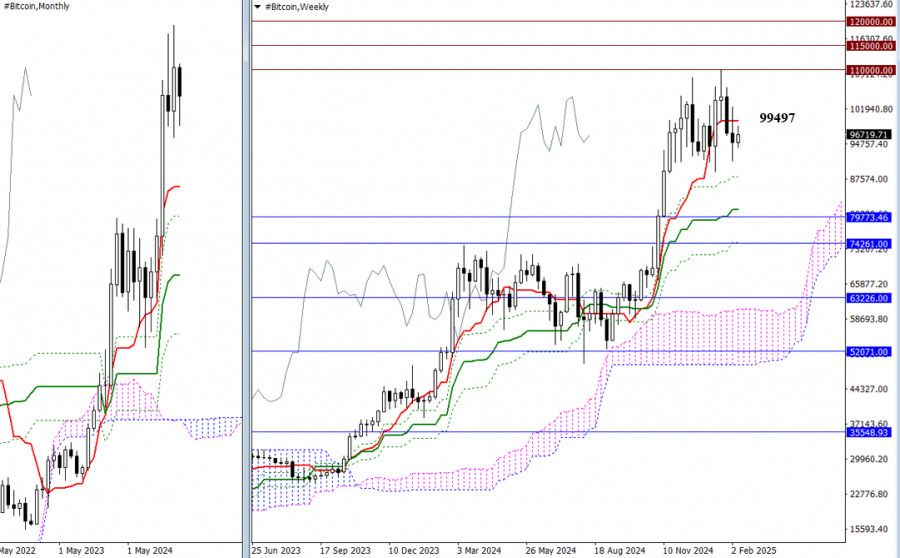
It's Friday, and Bitcoin continues to wait. Neither buyers nor sellers are making a decisive move, which creates ongoing uncertainty in the market. Key levels remain unchanged for both sides. For the bulls, the first significant challenge is to rise and consolidate above the weekly short-term trend level of 99,497. After achieving this, the focus will shift to psychologically important levels at 110,000, 115,000, and 120,000. For the bears, the critical concern is whether Bitcoin will test the weekly Ichimoku support levels at 88,040, 81,261, and 74,482, as well as the monthly levels at 79,774 and 74,261.
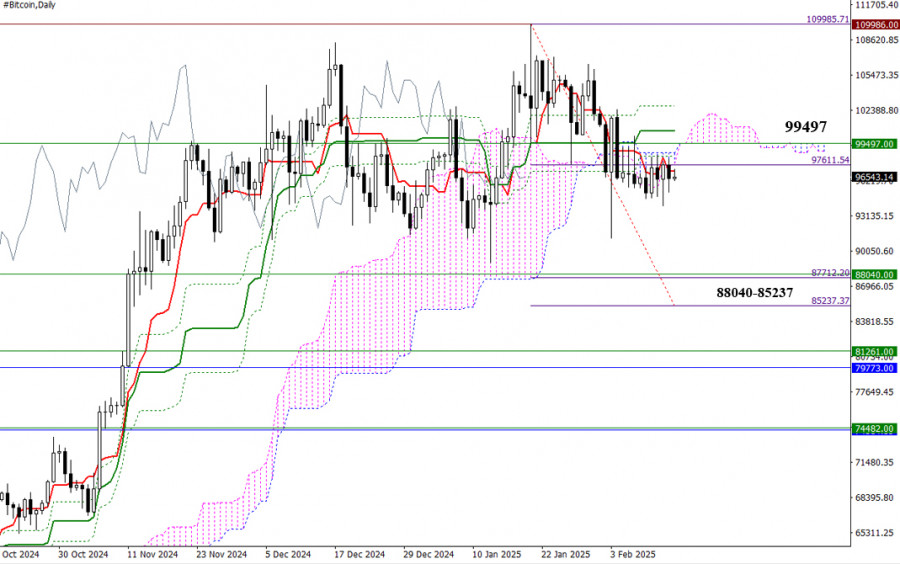
Uncertainty is evident on the daily timeframe, as the market appears stagnant. The entire Ichimoku structure, including the cross and cloud, is currently above the price chart, creating a broad resistance zone between 97,067 and 102,795. This zone is further reinforced by the weekly short-term trend level of 99,497. A solid breakout above this range could open new opportunities for buyers. Conversely, if the bears take control and move out of the current sideways movement, their primary target on the daily chart will be to break through the daily cloud, which ranges from 87,712 to 85,237. This area is strengthened by the weekly support at 88,040. If Bitcoin begins to decline, this level will become a focal point for sellers.
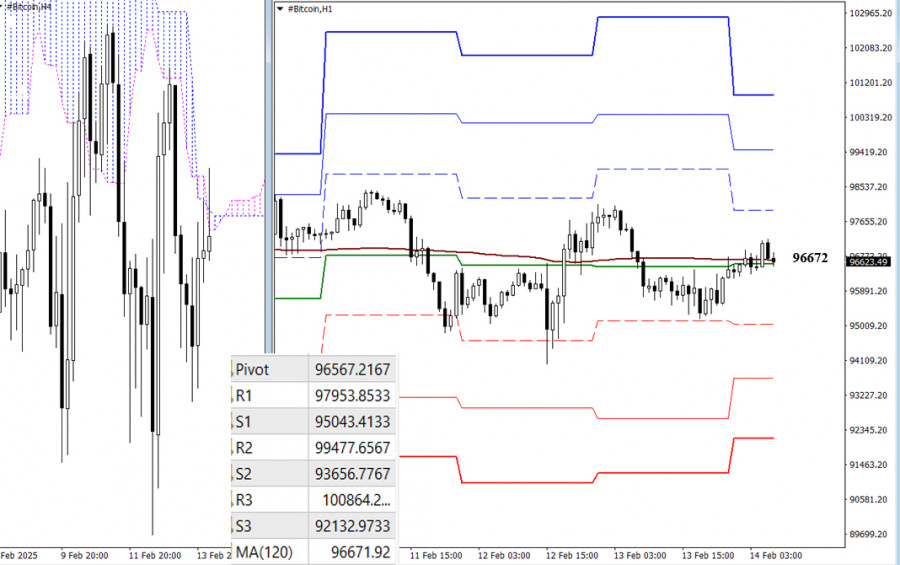
On lower timeframes, key levels have remained horizontal for an extended period, with the market fluctuating slightly above and below them without major deviations. This behavior further confirms a phase of prolonged uncertainty. Today, the key levels to watch are 96,567 and 96,672, which represent the central Pivot level and the weekly long-term trend. If market activity increases, intraday trading may involve classic Pivot support levels at 95,043, 93,657, and 92,133, as well as resistance levels at 97,954, 99,478, and 100,864.
***

SZYBKIE LINKI


 Skontaktuj się z ForexMart

