GBP/USD did not trade any better than EUR/USD on Monday. It managed to change direction three times during the day. Of course, there were quite a lot of macroeconomic statistics and some particular reports influenced the pair's movement. However, the pair successfully reversed even without their influence. For instance, by the time the US services PMI was released, the USD was already rallying against the EUR. And 15 minutes before it was published the business activity index for the same service sector, according to the S&P version, was disappointing and obviously could not provoke the strengthening of the US dollar. In general, a paradox on a paradox, and a total mess at the currency market. Nevertheless, I warned you that the ISM index is the most important report of the day, so the market's reaction to it is not surprising. But what sense is there in this reaction, if in 15 minutes the pair rose as much as it lost on the ISM index? It is impossible to form an ascending trend line for the pound, and we still expect a strong bearish correction, and I think it's unreasonable that the pair kept rising for the past few weeks.
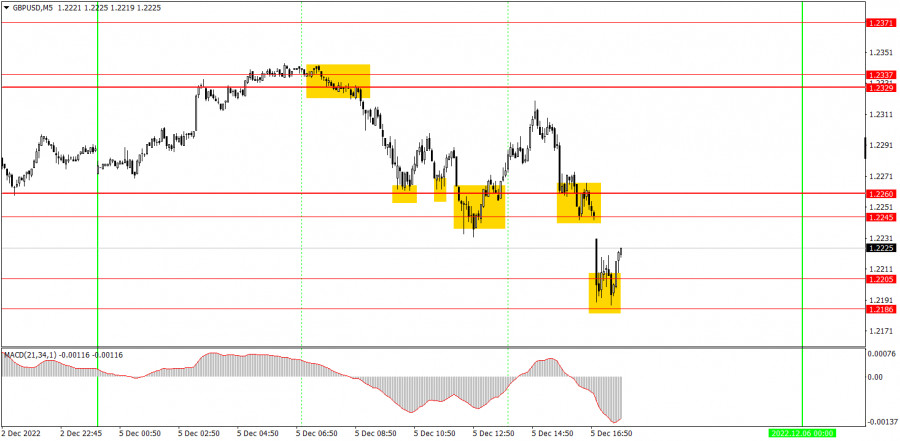
Trading signals on the 5-minute chart were a bit unfavorable. The first sell signal near 1.2329-1.2337 turned out to be profitable, as GBP reached the nearest level at 1.2260. The pair reached and rebounded from it three times in conjunction with 1.2245. Three buy signals, the first of which was closed by Stop Loss, the second and third were identical (only one long position should have been opened) and were also closed by Stop Loss, as the price failed to reach the target level. Next was a sell signal around 1.2245-1.2260, but it appeared at the same time when the ISM index was published. Therefore, there was no opportunity to use it. The last buy signal at 1.2186-1.2205 was formed rather late, so it should not have been used. In total, we have one profitable trade - the first one, for which we managed to earn about 40 points.
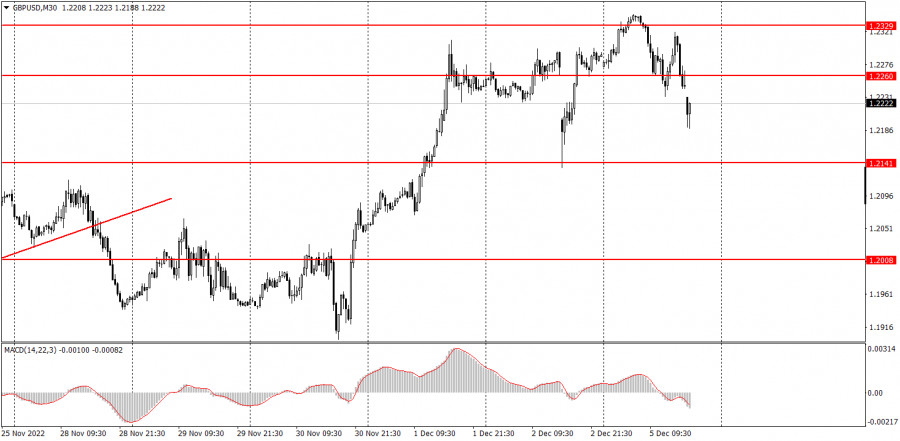
The pair is still near its local highs and can not start a tangible correction on the 30-minute time chart. Today's decline could be a starting point for it, but recently we have seen a lot of the same thing, and the pound is still rising anyway. Nevertheless, I still don't see any good reason for the pound to rise further. On the 5-minute TF on Tuesday, it is recommended to trade at the levels 1.1950-1.1957, 1.2064-1.2079, 1.2141, 1.2186-1.2205, 1.2245-1.2260, 1.2329-1.2337 and 1.2371. As soon as the price passes 20 pips in the right direction, you should set a Stop Loss to breakeven. On Tuesday, no important report or any other event will be published either in the UK or the US. Nevertheless, I believe that we will continue to witness quite volatile movements.
1) The strength of the signal is determined by the time it took the signal to form (a rebound or a breakout of the level). The quicker it is formed, the stronger the signal is.
2) If two or more positions were opened near a certain level based on a false signal (which did not trigger a Take Profit or test the nearest target level), then all subsequent signals at this level should be ignored.
3) When trading flat, a pair can form multiple false signals or not form them at all. In any case, it is better to stop trading at the first sign of a flat movement.
4) Trades should be opened in the period between the start of the European session and the middle of the US trading hours when all positions must be closed manually.
5) You can trade using signals from the MACD indicator on the 30-minute time frame only amid strong volatility and a clear trend that should be confirmed by a trendline or a trend channel.
6) If two levels are located too close to each other (from 5 to 15 pips), they should be considered support and resistance levels.
Support and Resistance levels are the levels that serve as targets when buying or selling the pair. You can place Take Profit near these levels.
Red lines are channels or trend lines that display the current trend and show in which direction it is better to trade now.
The MACD indicator (14, 22, and 3) consists of a histogram and a signal line. When they cross, this is a signal to enter the market. It is recommended to use this indicator in combination with trend patterns (channels and trendlines).
Important announcements and economic reports that can be found on the economic calendar can seriously influence the trajectory of a currency pair. Therefore, at the time of their release, we recommend trading as carefully as possible or exiting the market in order to avoid sharp price fluctuations.
Beginners on Forex should remember that not every single trade has to be profitable. The development of a clear strategy and money management is the key to success in trading over a long period of time.

SZYBKIE LINKI
ForexMart is authorized and regulated in various jurisdictions.
(Reg No.23071, IBC 2015) with a registered office at Shamrock Lodge, Murray Road, Kingstown, Saint Vincent and the Grenadines
Restricted Regions: the United States of America, North Korea, Sudan, Syria and some other regions.


 Skontaktuj się z ForexMart