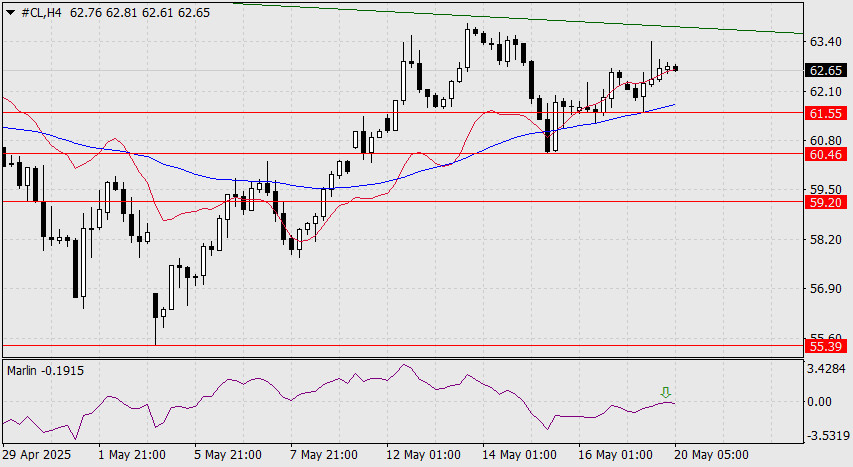
Yesterday's rise in oil was technically weak—neither the MACD line nor the embedded line of the descending price channel was reached. The daily close occurred below the balance line, and today's opening opened below all indicator lines.
The Marlin oscillator is showing signs of turning downward.
The current situation indicates the potential for a downward price movement over the coming weeks. The nearest targets are as follows:

On the H4 chart, the signal line of the Marlin oscillator is turning back deep into the bearish zone from the neutral zero line. The price needs this support, as it has not yet overcome support from the indicator lines.
A drop below 61.55 would indicate a confirmed move below the MACD line and simultaneously open the path to the target level at 60.46.
An alternative scenario, which would open up a broader prospect for price growth, would be activated if the price breaks above the May 13 high at 63.89. This could lead to a rally toward 71.47, which corresponds to the August 21, 2024 low (also the high on November 22 and December 16).

فوری رابطے