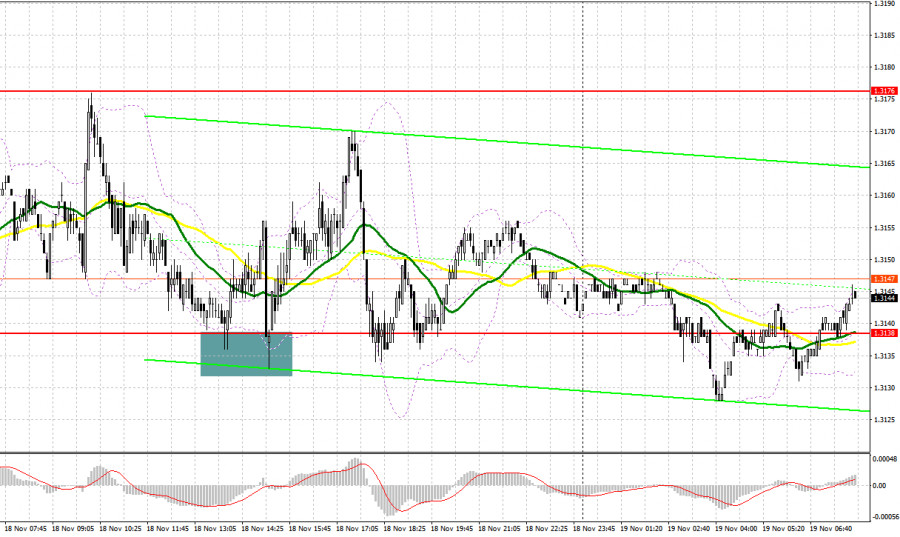
Yesterday, several entry points in the market were formed. Let's take a look at the 5-minute chart and analyze what happened. In my morning forecast, I highlighted the level of 1.3176 and planned to make market entry decisions based on it. The rise and formation of a false breakout around 1.3176 provided a sell entry point for the pound, resulting in a move of more than 25 pips. In the second half of the day, buyers appeared in the area of 1.3138, which allowed for long positions on a false breakout. As a result, the pair rose by more than 30 pips.
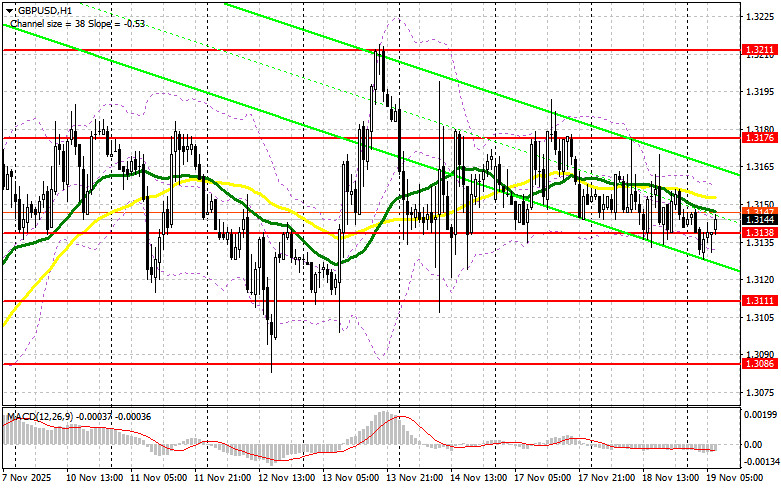
The absence of UK reports and budget-related news keeps the GBP/USD pair within a sideways channel. However, everything may change today. In the first half of the day, data on the UK Consumer Price Index and the core Consumer Price Index are expected. Economists forecast that price pressures may increase, strengthening the British pound. Otherwise, the pair will remain trading within the range. In that case, only the formation of a false breakout around the support level of 1.3138 will provide a reason to open long positions with the aim of raising the pair to resistance at 1.3176. A breakout and a reverse test from the top to the bottom of this range will increase the chances of strengthening GBP/USD, triggering stop orders for sellers and providing a suitable entry point for long positions, with potential to move up to 1.3211. The furthest target will be the area of 1.3244, where I plan to take profit. In the event of a decline in GBP/USD and a lack of buying activity at 1.3138, pressure on the pair will increase, leading to a move toward the next support level at 1.3111. Only the formation of a false breakout there will be an appropriate condition for opening long positions. I plan to buy GBP/USD immediately on a rebound from the low of 1.3086, aiming for a correction of 30-35 pips within the day.
Sellers showed themselves yesterday, but the price did not break out of the channel. In the event of a rise in GBP/USD after the inflation data, I expect bearish activity around the 1.3176 resistance level, which bulls have been unable to break through for quite some time. The formation of a false breakout there will be sufficient to sell the pound, aiming to move down to support at 1.3138. A breakout and a reverse test from bottom to top of this range will strike a heavier blow to buyers' positions, triggering stop orders and opening the way to 1.3111. The furthest target will be the area of 1.3086, where I will take profit. In the event of an upward move in GBP/USD and a lack of activity at 1.3176, buyers will have a chance for a larger increase in the pair, which may lead to continued bullish market formation. In this case, it is better to postpone short positions until the 1.3211 resistance level is tested. I plan to open shorts there only on a false breakout. In the absence of downward movement there, I will sell GBP/USD immediately on a rebound from 1.3244, but only in anticipation of a downward correction of the pair of 30-35 pips within the day.
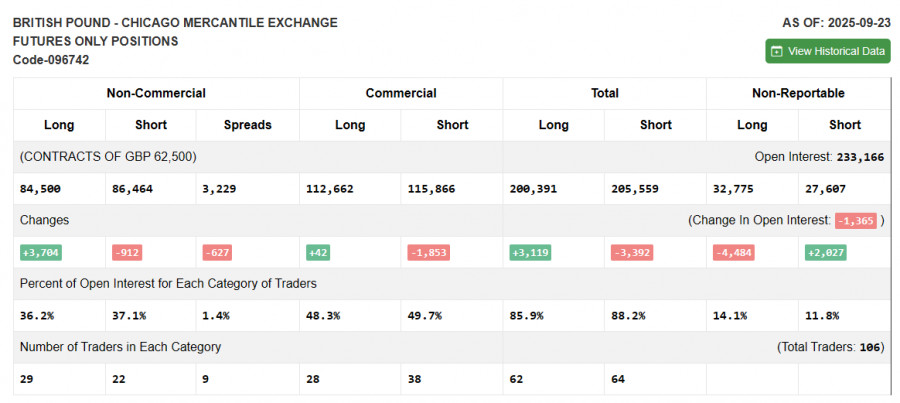
Due to the U.S. government shutdown, fresh Commitment of Traders data is not being published. The last relevant report is only from September 23.
In the COT report (Commitment of Traders) for September 23, there was a reduction in short positions and an increase in long positions. Pressure on the dollar remains, especially after recent data, likely forcing the U.S. Federal Reserve to continue lowering interest rates. At the same time, the Bank of England's stance remains cautious, indicating its clear plans to fight inflation further, though this has not provided much confidence for pound buyers recently. The short-term future dynamics of the GBP/USD exchange rate will be determined by new fundamental reports. The latest COT report shows that non-commercial long positions increased by 3,704 to 84,500, while non-commercial short positions decreased by 912 to 86,464. As a result, the spread between long and short positions decreased by 627.
Moving Averages
Trading is conducted around the 30 and 50-day moving averages, indicating market uncertainty.
Note: The period and prices of moving averages are considered by the author on the hourly chart H1 and differ from the general definition of classical daily moving averages on the daily chart D1.
Bollinger Bands
In the event of a decline, the indicator's lower boundary around 1.3135 will serve as support.

ລິ້ງດ່ວນ


 ຕິດຕໍ່ພວກເຮົາ

