On Tuesday, the EUR/USD pair started a correction against another correction. For two days, the price was falling, so amid an empty event calendar, a correction started. However, by the end of the day, we can say that the corrections are over, and now the downward movement should resume. At least, I'd like to believe that the downward movement should resume. The nature of the pair's movement has been such that even a trend line cannot be formed. The pair seems to be in an uptrend that has been going on for a month now, but it clearly wants to end it. The market has no reason to buy the euro after its 550-point rise. Macro data did not support the euro and still doesn't. The euro is overbought and needs a stronger correction. So I expect the euro to trade significantly lower, but for beginners who are trading intraday, it doesn't really matter which direction the price is moving in.
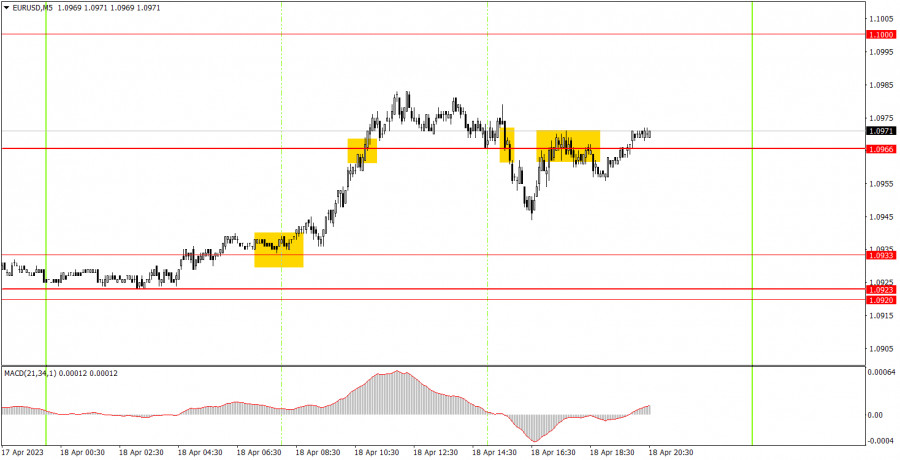
There were enough signals on the 5-minute chart, and not the worst ones. First, the pair bounced off 1.0933, afterwards it managed to go up about 40 points, overcoming the 1.0966 level along the way. Take note that volatility was low. The long positions should have been closed at the first sell signal, which was formed at the beginning of the US session when the price dropped back below 1.0966. Therefore, the profit on longs was about 10-15 points. The sell signal could also be worked out, but the price almost immediately returned to 1.0966, where it stayed until the evening. Therefore, this should have been closed manually, and there might have been minimal losses. Overall, the day ended with no profit.
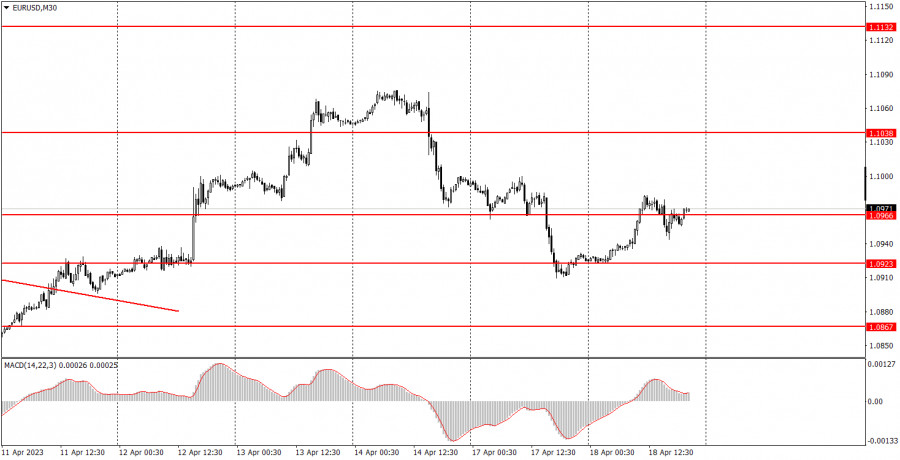
On the 30-minute chart, the pair started to trade lower, which could be (as in previous instances) a pullback before the euro starts to rise again. Unfortunately, the current situation does not allow us to confirm in which direction the movement will be in the coming week. The euro is overbought and should fall further, but the market may still start forming a new wave of baseless growth. On the 5-minute chart, consider levels 1.0792, 1.0857-1.0867, 1.0920-1.0933, 1.0966, 1.1000, 1.1038, 1.1070, 1.1132, 1.1184, 1.1228. As soon as the price passes 15 pips in the right direction, you should set a Stop Loss to breakeven. On Wednesday, the final consumer price index for March will be published in the European Union, which is unlikely to differ significantly from the first estimate. This means that the market will hardly react to to this report. In the United States, the "Beige Book" - a summary of the Fed's economic reports - will be released late in the evening.
1) The strength of the signal is determined by the time it took the signal to form (a rebound or a breakout of the level). The quicker it is formed, the stronger the signal is.
2) If two or more positions were opened near a certain level based on a false signal (which did not trigger a Take Profit or test the nearest target level), then all subsequent signals at this level should be ignored.
3) When trading flat, a pair can form multiple false signals or not form them at all. In any case, it is better to stop trading at the first sign of a flat movement.
4) Trades should be opened in the period between the start of the European session and the middle of the US trading hours when all positions must be closed manually.
5) You can trade using signals from the MACD indicator on the 30-minute time frame only amid strong volatility and a clear trend that should be confirmed by a trendline or a trend channel.
6) If two levels are located too close to each other (from 5 to 15 pips), they should be considered support and resistance levels.
Support and Resistance levels are the levels that serve as targets when buying or selling the pair. You can place Take Profit near these levels.
Red lines are channels or trend lines that display the current trend and show in which direction it is better to trade now.
The MACD indicator (14, 22, and 3) consists of a histogram and a signal line. When they cross, this is a signal to enter the market. It is recommended to use this indicator in combination with trend patterns (channels and trendlines).
Important announcements and economic reports that can be found on the economic calendar can seriously influence the trajectory of a currency pair. Therefore, at the time of their release, we recommend trading as carefully as possible or exiting the market in order to avoid sharp price fluctuations.
Beginners on Forex should remember that not every single trade has to be profitable. The development of a clear strategy and money management is the key to success in trading over a long period of time.


 联系我们
联系我们 

