On Wednesday, EUR/USD continued to trade in the "swing" mode, although we should acknowledge that the pair's decline is not technical. In the morning, we learned that one of the largest banks of the European Union (more precisely Switzerland) Credit Suisse is experiencing some problems and needs additional cash injections. Credit Suisse shares immediately collapsed, and along with it, shares of many other related companies and banks as well. The euro followed right after. The collapse was about 200 pips and the pair was only able to pull up a bit in the evening. All the macro data of the day, both European and American, did not matter. The market had its eyes on the next big and important fundamental event, which could have a devastating effect on the pair for several days. Moreover, the news about the problems or the collapse of the banks can continue to come.
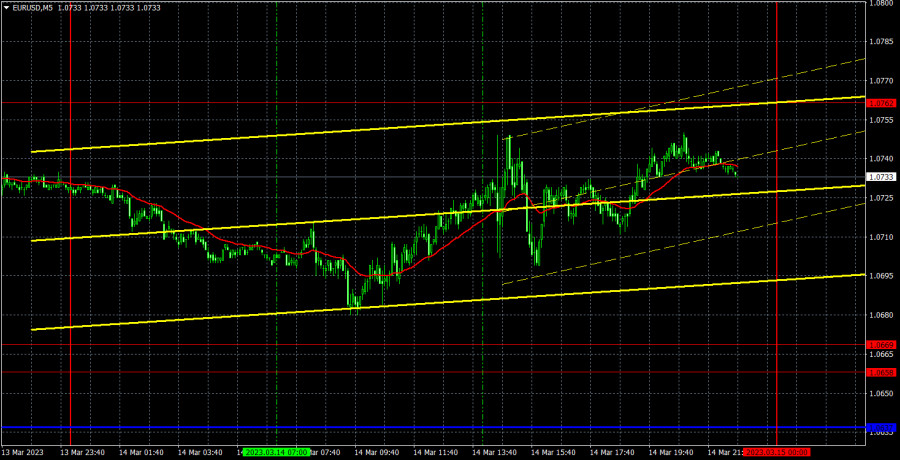
In the evening, there was a sell signal near 1.0762. By the opening of the European trading session, the pair moved away from the point of formation by only 5 pips, so it was safe to open a short position. Unfortunately, the price stalled in the area near 1.0669, due to which traders could close shorts. Profit was 60 pips, while the long position opened on the same signal was a complete loss (40 pips). But the next sell signal (overcoming the critical line) was strong, and the pair reached 1.0537 in the US session, from which it bounced. Shorts should have been closed here, the profit was another 90 pips. Traders should decide whether or not to open new positions after the fall of 200 points, but it was definitely not necessary to work off one more sell signal around 1.0537. The two buy signals made it possible for us to earn a couple dozens of points more.
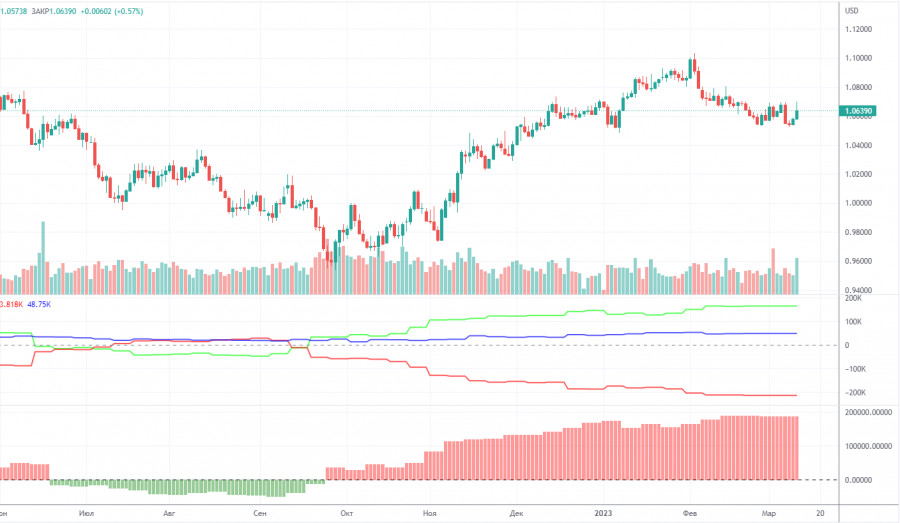
A new COT report came out on Friday... for February 21... That was almost a month ago, while the report of February 14 has disappeared... It seems that the Commodity Futures Trading Commission will now publish reports with a month's delay for some time. In the event of this, the reports will hardly be of great importance. Recall that there was a technical glitch in the CFTC, so the data we receive now is considered irrelevant. So far, we can say that in the last few months, the overall picture has been corresponding to the market situation. On the chart above, we see that the net non-commercial position of large traders (second indicator) has risen since September 2022. At about the same time, the euro started to rise. The net non-commercial position is bullish and continues to increase with each new week, allowing us to expect the uptrend to stop shortly. Such a signal comes from the first indicator, with the green line and the red line being far apart, which is usually a sign of the end of a trend. The euro has already begun its bearish move against the greenback. So far, it remains unclear whether it is just a bearish correction or a new downtrend? According to the latest report, non-commercial traders closed 100 long positions, and 1,300 short ones. Consequently, the net position rose by 1,200. The number of long positions exceeds that of short ones by 165,000. In any case, a correction has been looming for a long time. Therefore, even without reports, it is clear that the downtrend will continue.
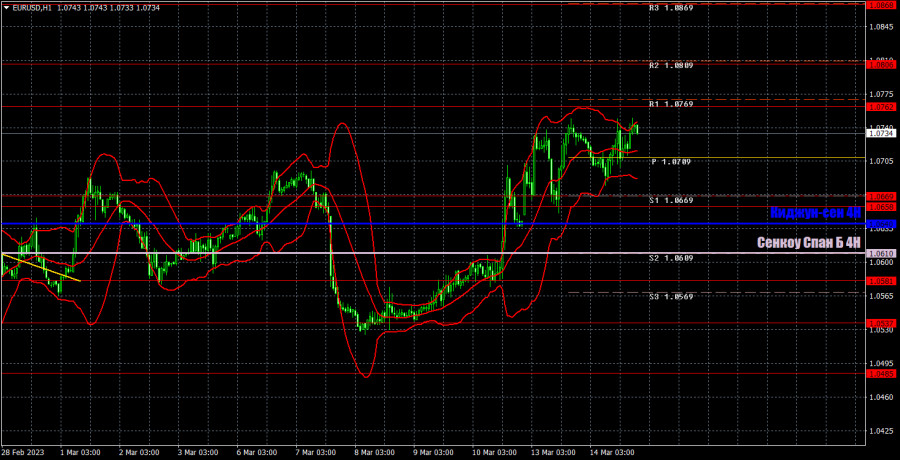
On the one-hour chart, EUR/USD surged, which was eventually replaced by an equally strong fall, just like I predicted yesterday. The "swing" continues, and I would not be surprised if a new round of upward movement will start today or tomorrow. Moreover, Thursday's fundamental background will be quite strong again. On Thursday, important levels are seen at 1.0340-1.0366, 1.0485, 1.0537, 1.0581, 1.0658-1.0669, 1.0762, 1.0806, 1.0868, and also Senkou Span B (1.0610) and Kijun Sen (1.0639). Ichimoku indicator lines can move intraday, which should be taken into account when determining trading signals. There are also support and resistance although no signals are made near these levels. They could be made when the price either breaks or rebounds from these extreme levels. Do not forget to place Stop Loss at the breakeven point when the price goes by 15 pips in the right direction. In case of a false breakout, it could save you from possible losses. On March 16, a sum-up of the European Central Bank meeting and ECB President Christine Lagarde's speech. In the US, just a couple of minor reports, which the market will probably disregard.
Resistance/support - thick red lines, near which the trend may stop. They do not make trading signals.
Kijun-sen and Senkou Span B are the Ichimoku indicator lines moved to the hourly timeframe from the 4-hour timeframe. They are also strong lines.
Extreme levels are thin red lines, from which the price used to bounce earlier. They can produce trading signals.
Yellow lines are trend lines, trend channels, and any other technical patterns.
Indicator 1 on the COT chart is the size of the net position of each trader category.
Indicator 2 on the COT chart is the size of the net position for the Non-commercial group of traders.


 联系我们
联系我们 

