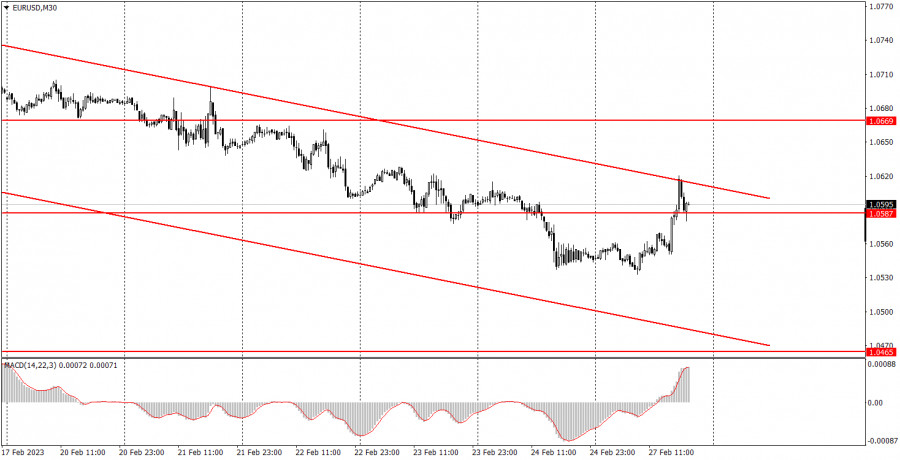
EUR/USD corrected rather unexpectedly on Monday, but it remained within the descending channel, rebounding from its upper limit. Thus, it turns out that the pair has maintained the downtrend. Until the price remains above the descending channel, I do not expect the euro to rise. Theoretically, the bullish correction might continue, but I do not expect the recovery of the global uptrend, which was formed within the last 4-6 months. The euro's growth was triggered by weak results on the US Durable Goods reports. The report showed a stronger contraction, which caused the dollar to fall. I already mentioned that this report has not provoked a strong market reaction in the last few years. Today it triggered a 60-point move, which might be considered something of an exception to the rule. With the current technical picture, I think that it is more reasonable to wait for a new round of decline.
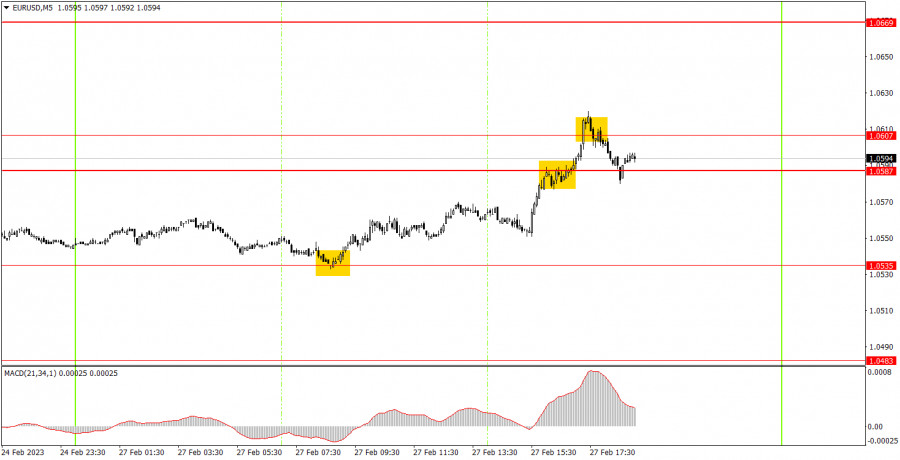
There were few trading signals on Monday, but it was moving in a trend. At the beginning of the European session, the pair rebounded from 1.0535 and rose to 1.0587, and then overcame 1.0607. The price failed to rise above this level, so if the price rebounded below 1.0607, the long position could be closed. Its profit was about 50 pips. There was no point in trying to work out the last sell signal, because it was formed quite late.
On the 30-minute chart, the pair maintains a bearish trend and remains within the descending channel. Thus, for the time being, we expect a continuation of the euro's decline. This week there will be some reports that will be able to dramatically affect traders' mood. But not on Tuesday. On the 5-minute chart, it is recommended to trade at the levels 1.0391, 1.0433, 1.0465-1.0483, 1.0535, 1.0587-1.0607, 1.0669, 1.0697, 1.0792. As soon as the price passes 15 pips in the right direction, you should set a Stop Loss to breakeven. On Tuesday, there is not a single report or important event scheduled in the US and the EU. Traders will have absolutely nothing to react to during the day. In a way, it is good, because only technical factors will be taken into consideration without worrying about a strong influence from the fundamentals or macroeconomics. Monday was quite volatile, but Tuesday could be more boring.
1) The strength of the signal is determined by the time it took the signal to form (a rebound or a breakout of the level). The quicker it is formed, the stronger the signal is.
2) If two or more positions were opened near a certain level based on a false signal (which did not trigger a Take Profit or test the nearest target level), then all subsequent signals at this level should be ignored.
3) When trading flat, a pair can form multiple false signals or not form them at all. In any case, it is better to stop trading at the first sign of a flat movement.
4) Trades should be opened in the period between the start of the European session and the middle of the US trading hours when all positions must be closed manually.
5) You can trade using signals from the MACD indicator on the 30-minute time frame only amid strong volatility and a clear trend that should be confirmed by a trendline or a trend channel.
6) If two levels are located too close to each other (from 5 to 15 pips), they should be considered support and resistance levels.
Support and Resistance levels are the levels that serve as targets when buying or selling the pair. You can place Take Profit near these levels.
Red lines are channels or trend lines that display the current trend and show in which direction it is better to trade now.
The MACD indicator (14, 22, and 3) consists of a histogram and a signal line. When they cross, this is a signal to enter the market. It is recommended to use this indicator in combination with trend patterns (channels and trendlines).
Important announcements and economic reports that can be found on the economic calendar can seriously influence the trajectory of a currency pair. Therefore, at the time of their release, we recommend trading as carefully as possible or exiting the market in order to avoid sharp price fluctuations.
Beginners on Forex should remember that not every single trade has to be profitable. The development of a clear strategy and money management is the key to success in trading over a long period of time.


 联系我们
联系我们 

