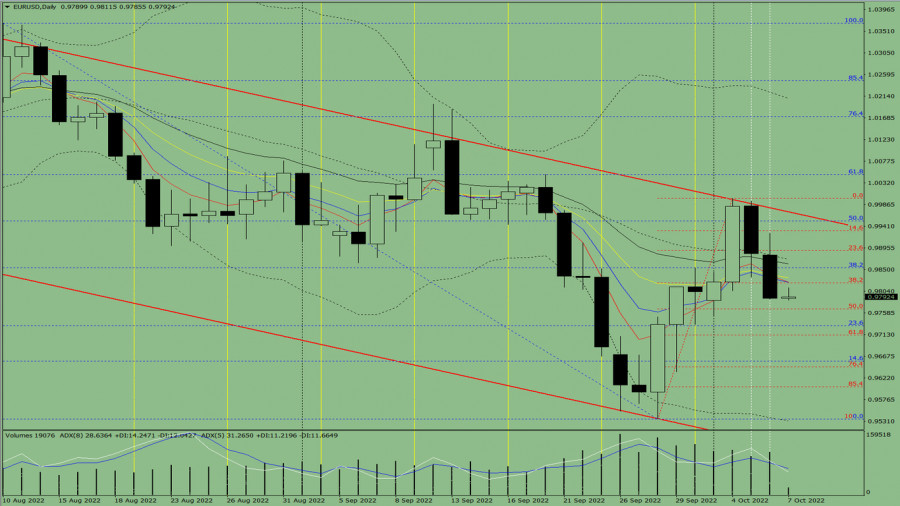
Trend analysis (fig. 1).
Today, the pair may start moving up to 0.9853 (blue dotted line), the Fibo level of 38.2%, from 0.9798, the closing of yesterday's daily candlestick. If the price hits this level, it is likely to climb to 0.9952, the Fibo retracement level of 50.0% (blue dotted line). When testing this level, it may retreat.
Fig. 1 (daily chart).
Complex analysis:
- indicator analysis –up;
- Fibonacci retracement levels– up;
- trading volumes – up;
- candlestick analysis – up;
- trend analysis – up;
- Bollinger bands – down;
- weekly chart-up.
Conclusion:
Today, the pair may start moving up to 0.9853 (blue dotted line), the Fibo level of 38.2%, from 0.9798, the closing of yesterday's daily candlestick. If the price hits this level, it is likely to climb to 0.9952, the Fibo retracement level of 50.0% (blue dotted line). When testing this level, it may retreat.
Alternatively, the price could decline to 0.9767 (red dotted line), the Fibo retracement level of 50.0%, from 0.9798 (closing of yesterday's daily candlestick). After reaching this level, it may grow to 0.9853, the Fibo retracement level of 38.2% (blue dotted line). When testing this level, the pair could rise higher.
ForexMart is authorized and regulated in various jurisdictions.
(Reg No.23071, IBC 2015) with a registered office at Shamrock Lodge, Murray Road, Kingstown, Saint Vincent and the Grenadines
Restricted Regions: the United States of America, North Korea, Sudan, Syria and some other regions.


 联系我们
联系我们