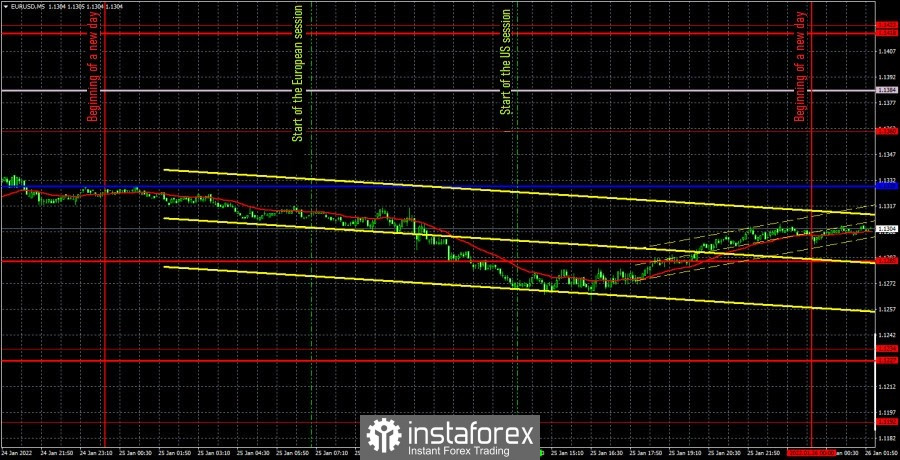
EUR/USD 5M
The EUR/USD pair continued to slide slowly down on Tuesday. If a day earlier there was more horizontal movement, then yesterday it was already descending. The total volatility of the day was about 65 points, which is not so small for a day with an almost completely empty calendar of macroeconomic and fundamental events. The main thing is different. Traders have again found reasons to buy the dollar. In our recent fundamental articles, we have already listed all the possible reasons for the dollar's growth and concluded that such a development of events is now the most likely. Thus, we continue to expect the pair to fall at least to the level of 1.1234, which is the lower limit of the last horizontal channel. Of course, in many ways, the pair's movement in the near future will depend on today, as the results of the Federal Reserve meeting may cause a strong reaction from traders. However, we also recall that the reaction may be local, and not form a trend. That is, in the context of one day, the movement may be strong, but it may not affect the overall mood of the market in any way. Moreover, now the Fed's policy is aimed at tightening, and tightening monetary policy is a bullish factor for the national currency. Now let's move on to the consideration of trading signals. However, there is not much to talk about here, since yesterday not a single trading signal was formed during the day. The only thing we can pay attention to is the movement of the pair itself. The price bounced off the critical line at night, so if suddenly one of the traders was able to work out this sell signal, he/she got a good profit. But most traders still sleep at night, and the Kijun-sen line is not a clear level, so it is impossible to place a pending order near it, since it can change its position.
We recommend to familiarize yourself with:
Overview of the EUR/USD pair. January 26. First Fed meeting this year. What will be the results?
Overview of the GBP/USD pair. January 26. Boris Johnson keeps his name on the front pages of newspapers. The situation in Eastern Europe is heating up.
Forecast and trading signals for GBP/USD on January 26. Detailed analysis of the movement of the pair and trading transactions.
EUR/USD 1H
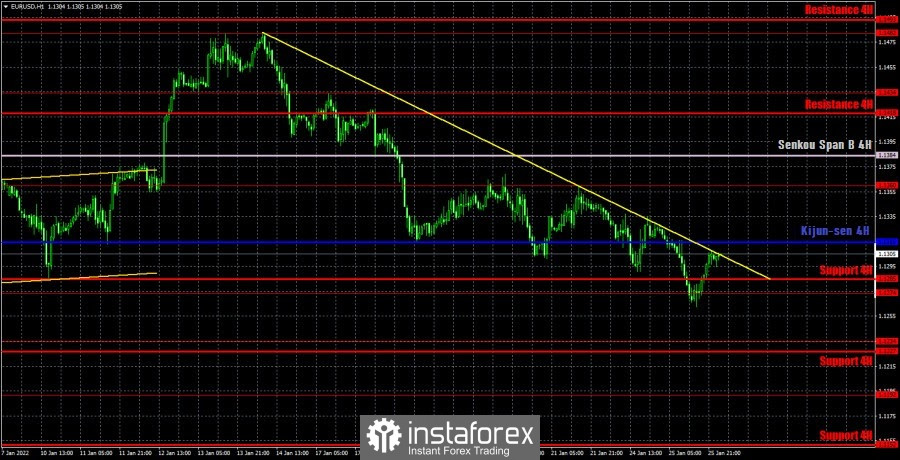
The technical picture on the hourly timeframe remains quite complex or, at least, ambiguous. A new descending trend line has been formed, and the price is located below both lines of the Ichimoku indicator. However, there is still a danger that the price has decided to return to the 1.1234-1.1360 horizontal channel. Thus, you also need to be prepared for a possible flat. However, before the price settles above the descending trend line, we believe that there is more chance of continuing the downward movement. We allocate the following levels for trading on Wednesday - 1.1192, 1.1234, 1.1274, 1.1360, as well as the Senkou Span B(1.1384) and Kijun-sen(1.1315) lines. The lines of the Ichimoku indicator may change their position during the day, which should be taken into account when searching for trading signals. Signals can be "bounces" and "breakthroughs" of these levels and lines. Do not forget about placing a Stop Loss order at breakeven if the price went in the right direction of 15 points. This will protect you against possible losses if the signal turns out to be false. Nothing interesting planned in the European Union on January 26. But in the United States, the results of the Fed meeting will be published, a press conference with Jerome Powell will be held, and several minor macroeconomic reports will be released. Naturally, markets will be focused on the first and second events. The reaction to them can be very strong, but only on Wednesday evening.
Explanations for the chart:
Support and Resistance Levels are the levels that serve as targets when buying or selling the pair. You can place Take Profit near these levels.
Kijun-sen and Senkou Span B lines are lines of the Ichimoku indicator transferred to the hourly timeframe from the 4-hour one.
Support and resistance areas are areas from which the price has repeatedly rebounded off.
Yellow lines are trend lines, trend channels and any other technical patterns.
Indicator 1 on the COT charts is the size of the net position of each category of traders.
Indicator 2 on the COT charts is the size of the net position for the non-commercial group.
ForexMart is authorized and regulated in various jurisdictions.
(Reg No.23071, IBC 2015) with a registered office at Shamrock Lodge, Murray Road, Kingstown, Saint Vincent and the Grenadines
Restricted Regions: the United States of America, North Korea, Sudan, Syria and some other regions.


 联系我们
联系我们