Trade analysis and recommendations for trading the Japanese yen
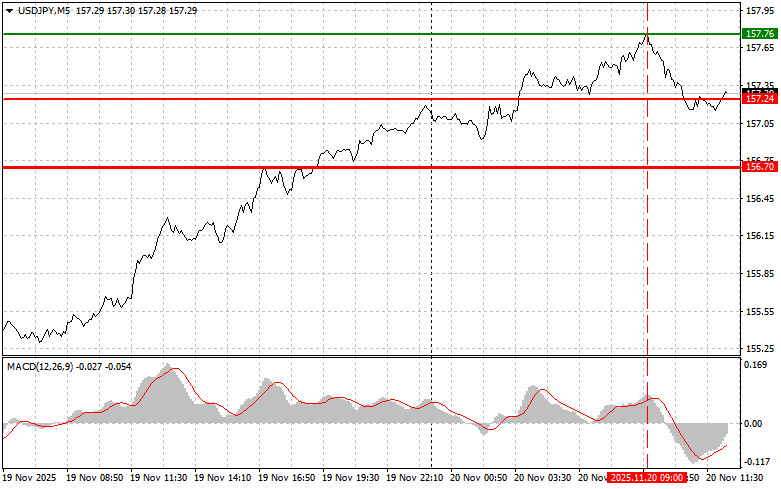
The test of the 157.76 price level occurred when the MACD indicator had already risen significantly above the zero line, which limited the pair's upward potential. For this reason, I did not buy the dollar.
Ahead of us are figures on U.S. non-farm payrolls, the unemployment rate, average hourly earnings, and the change in private-sector employment. These indicators, like a finely tuned musical score, can orchestrate sentiment in the financial markets, determining directional movements in currency pairs—especially those involving the U.S. dollar. Changes in non-farm payrolls act as a barometer of economic activity. The unemployment rate serves as an indicator of social stability, signaling potential societal challenges and pressure on public finances. If the data turns sharply negative, the Federal Reserve may be forced to cut rates in December, which would weaken the dollar immediately.
Equally important is the change in average hourly earnings, as this indicator reflects inflation dynamics and directly influences consumer spending. On one hand, rising wages stimulate demand, but on the other, they can provoke an inflationary spiral, prompting the Federal Reserve to adopt stricter measures to control prices. Finally, the change in private-sector employment helps assess the role of small and medium-sized businesses in creating new jobs and maintaining economic growth.
Together, these four indicators provide a comprehensive view of the U.S. labor market and offer valuable insight for investment decisions. Given their importance, we can confidently say that today will be a defining day for the financial markets in the near term.
As for the intraday strategy, I will rely primarily on scenarios No. 1 and No. 2.
Buy Signal
Scenario No. 1: I plan to buy USD/JPY today upon reaching the entry point near 157.45 (green line on the chart), with a target of rising to 157.95 (thicker green line on the chart). Around 157.95, I will exit buy positions and open sell positions in the opposite direction (expecting a 30–35 point reversal from that level). Growth in the pair can be expected as part of the ongoing bullish market. Important! Before buying, make sure the MACD indicator is above the zero line and just beginning to rise from it.
Scenario No. 2: I also plan to buy USD/JPY if the price twice tests the 157.00 level while the MACD indicator is in the oversold zone. This will limit the pair's downward potential and trigger an upward reversal. Growth toward 157.45 and 157.95 can be expected.
Sell Signal
Scenario No. 1: I plan to sell USD/JPY today after the price breaks below 157.00 (red line on the chart), which should lead to a quick decline. The key target for sellers will be 156.50, where I will exit sales and immediately open buy positions in the opposite direction (expecting a 20–25 point rebound from that level). Pressure on the pair is unlikely to return today. Important! Before selling, make sure the MACD indicator is below the zero line and just beginning to decline from it.
Scenario No. 2: I also plan to sell USD/JPY if the price twice tests 157.45 while the MACD indicator is in the overbought zone. This will limit the pair's upward potential and lead to a downward reversal. A decline toward 157.00 and 156.50 can be expected.
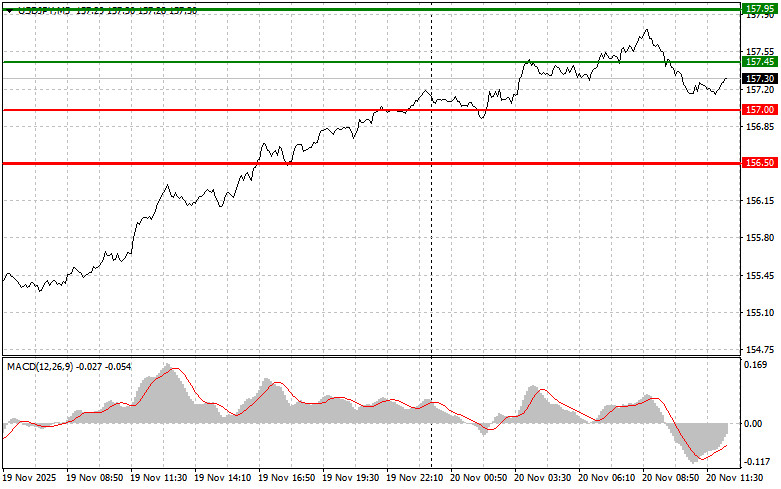
What the chart shows:
Important
Beginner Forex traders must make market-entry decisions with extreme caution. Before major fundamental reports are released, it is best to stay out of the market to avoid sharp price fluctuations. If you choose to trade during news releases, always set stop orders to minimize losses. Without stop orders, you may quickly lose your entire deposit—especially if you ignore money management and trade large volumes.
And remember: for successful trading, you must have a clear trading plan, like the one I outlined above. Spontaneous decision-making based on the current market situation is inherently a losing strategy for an intraday trader.

HIZLI BAĞLANTILAR
show error
Unable to load the requested language file: language/turkish/cookies_lang.php
date: 2025-11-20 02:38:27 IP: 216.73.216.30


 Bize Ulaşın

