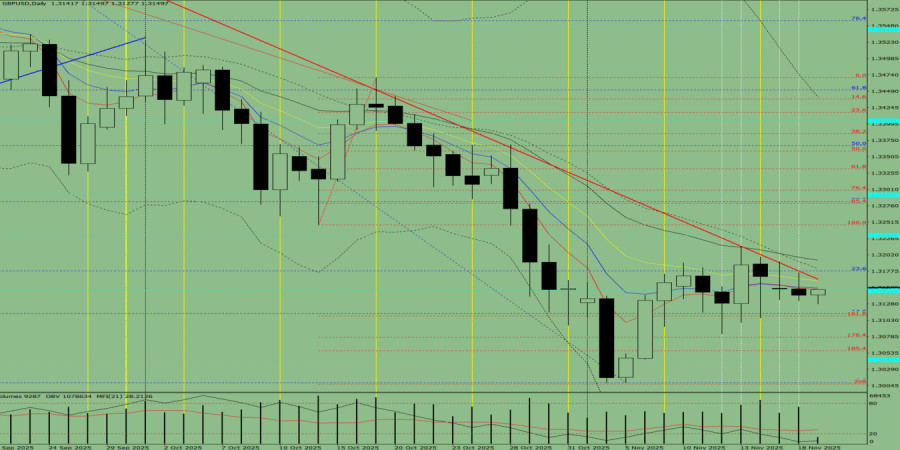
Trend Analysis (Fig. 1).
On Wednesday, the market may begin moving upward from the 1.3141 level (yesterday's daily candle close), targeting 1.3194 — the 21-period EMA (thin black line). When testing this line, the price may pull back downward toward 1.3178 — the 23.6% retracement level (blue dashed line).
Figure 1 (daily chart).
Comprehensive Analysis:
Overall conclusion: an upward trend.
Alternative scenario: On Wednesday, the market may begin moving upward from the 1.3141 level (yesterday's daily candle close), targeting 1.3232 — a historical resistance level (blue dashed line). When testing this line, the price may pull back downward toward 1.3194 — the 21-period EMA (thin black line).

HIZLI BAĞLANTILAR
show error
Unable to load the requested language file: language/turkish/cookies_lang.php
date: 2025-11-19 11:07:26 IP: 216.73.216.30


 Bize Ulaşın

