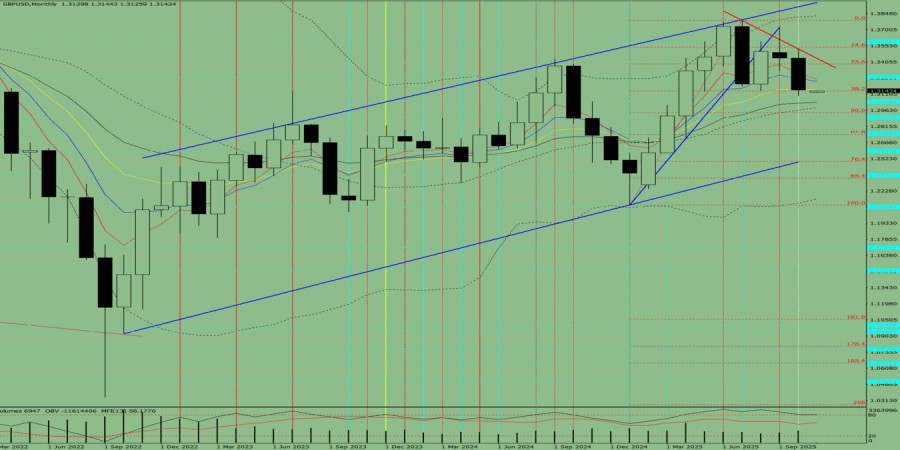
Fig. 1 (Monthly Chart).
Indicator Analysis:
Conclusion from comprehensive analysis: A downward trend is possible.
Overall summary of the monthly GBP/USD candle calculation:The price will most likely show a downward trend, with no upper shadow on the monthly black (bearish) candle (the first week of the month – bearish), and with the second lower shadow forming later (the last week of the month – bullish).
Alternative scenario:From the 1.3151 level (closing of the October monthly candle), the price may continue moving downward toward 1.2743 – the 61.8% retracement level (red dashed line). Upon testing this level, the price may rebound upward toward 1.2900 – the historical resistance level (light blue dashed line).

HIZLI BAĞLANTILAR
show error
Unable to load the requested language file: language/turkish/cookies_lang.php
date: 2025-11-06 08:30:42 IP: 216.73.216.166


 Bize Ulaşın

