Podle zprávy Punchbowl News americký prezident Donald Trump soukromě vyzval předsedu Sněmovny reprezentantů Mikea Johnsona, aby zvýšil nejvyšší daňovou sazbu a zrušil daňovou mezeru pro odložené úroky. Soukromý telefonát mezi oběma představiteli se uskutečnil ve středu.
Mezeru v zákoně o odložených úrocích tvoří ustanovení daňového zákoníku, které umožňuje investičním manažerům platit daně ze svých zisků nižší sazbou daně z kapitálových výnosů namísto vyšší sazbou daně z příjmu. Trumpův návrh na odstranění této mezery by pro tyto osoby znamenal zvýšení daní.
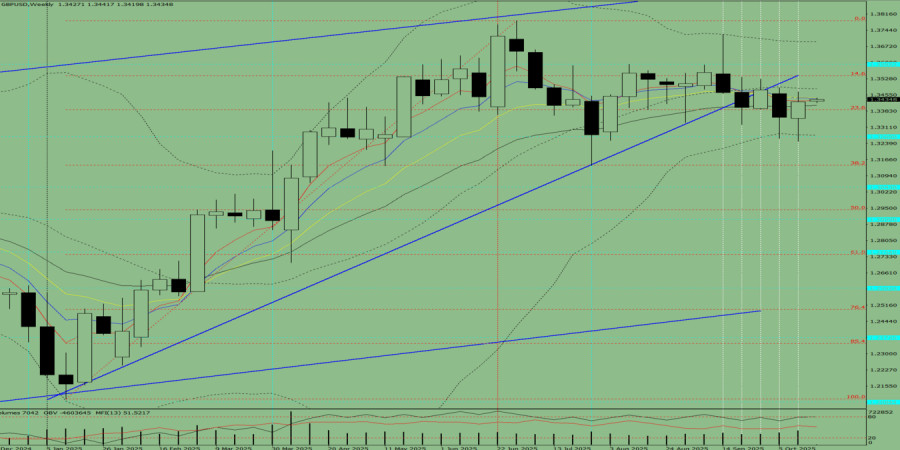
Trend Analysis
This week, from the level of 1.3429 (the closing price of the last weekly candle), the price may begin moving downward toward 1.3141 — the 38.2% retracement level (red dashed line). Upon testing this level, the price may retrace upward toward 1.3270 — the historical support level (blue dashed line).
Fig. 1 (Weekly Chart)
Overall conclusion: During the week, the GBP/USD price is most likely to follow a downward trend, forming a black weekly candle with a first upper shadow (Monday — upward movement) and a second lower shadow (Friday — upward movement).
Alternative Scenario:
From the level of 1.3429 (the closing price of the last weekly candle), the price may begin moving downward toward 1.3369 — the historical support level (blue dashed line). Upon reaching this level, the price may move upward toward 1.3389 — the 23.6% retracement level (red dashed line).

HIZLI BAĞLANTILAR
show error
Unable to load the requested language file: language/turkish/cookies_lang.php
date: 2025-10-21 06:41:17 IP: 216.73.216.208


 Bize Ulaşın

