Akcie britského internetového prodejce módy ASOS PLC ve čtvrtek klesly o zhruba 1 %, protože prodejce módy oznámil výsledky za první pololetí, které ukázaly, že tržby zaostaly za očekáváním trhu a že EBIT byl nižší, přestože EBITDA byl vyšší.
Tržby společnosti za první pololetí dosáhly 1,29 mld. liber, což mírně zaostalo za konsensem agentury Bloomberg ve výši 1,32 mld. liber a představovalo upravený srovnatelný pokles o 13 % ve srovnání se stejným obdobím loňského roku.
Upravený zisk EBITDA společnosti za první pololetí dosáhl 42,5 mil. liber, což bylo více než konsensus agentury Bloomberg, který činil přibližně 36 mil. liber.
Očištěný EBIT však zaostal za očekáváním, což přispělo k poklesu akcií. Společnost ASOS zachovala svůj výhled upraveného zisku EBITDA pro 25. fiskální rok, ale očekává růst tržeb na spodní hranici konsensu, tedy mezi -2 % a -9 %.
Trend Analysis.
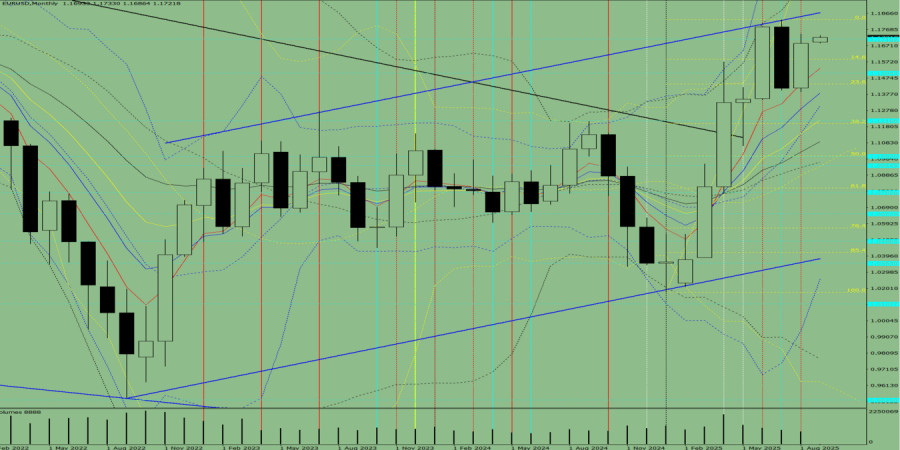
In September, from the level of 1.1685 (close to the August monthly candle), the price may begin a downward movement targeting 1.1438 – retracement level 23.6% (yellow dotted line). From this level, a corrective upward move is possible, with a target at 1.1504 – historical resistance level (blue dotted line).
Fig. 1 (monthly chart).
Indicator Analysis:
Conclusion from comprehensive analysis: a downward trend is possible.
Overall monthly outlook for the EUR/USD candle on the monthly chart: the price will most likely show a downward trend, with no initial upper shadow on the monthly black candle (first week of the month – black) and with a lower shadow present (last week of the month – white).
Alternative scenario: from the level of 1.1685 (close of the August monthly candle), the price may start moving downward toward 1.1504 – historical resistance level (blue dotted line). From this level, the market may then move upward with a target at 1.1588 – historical resistance level (blue dotted line).

HIZLI BAĞLANTILAR
show error
Unable to load the requested language file: language/turkish/cookies_lang.php
date: 2025-09-16 11:33:00 IP: 216.73.216.187


 Bize Ulaşın

