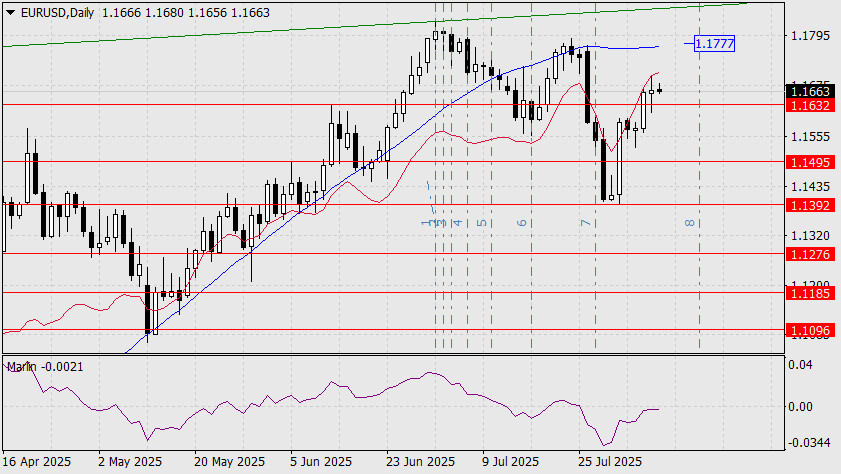
It appears that the 1.1392–1.1632 range (or slightly higher) is quite comfortable for the euro, with substantial retail buy orders starting to accumulate within it. But therein lies the well-known trap.
We also observe that the price did not break above the balance indicator line yesterday, and the Marlin oscillator began to reverse without touching the zero line. This suggests that the entire five-day rally was corrective in nature. At the very least, we need initial confirmation — a daily close below the 1.1632 level.
Since the euro is moving within a wide range, the final confirmation would be a drop below the lower boundary at 1.1392. The Fibonacci time grid suggests that such a decline could begin in about a week (after August 18), beyond the 8th line. Until then, the pair continues to drift freely. The upper limit of this movement is the MACD line near 1.1777.
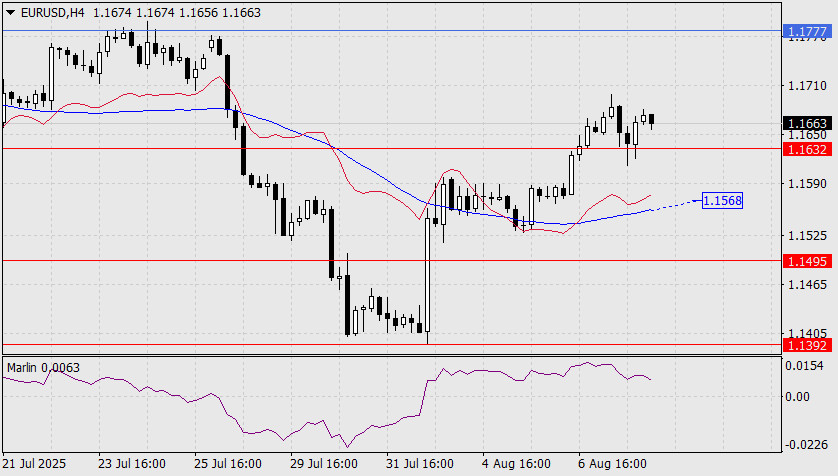
On the four-hour chart, the Marlin oscillator is heading lower, possibly aiming to enter negative territory. This may signal a setup for the price to breach the MACD line at 1.1568. However, even breaking through that line would likely remain just a part of the broader sideways movement in the euro.

HIZLI BAĞLANTILAR
show error
Unable to load the requested language file: language/turkish/cookies_lang.php
date: 2026-01-13 05:26:30 IP: 172.18.0.1


 Bize Ulaşın

