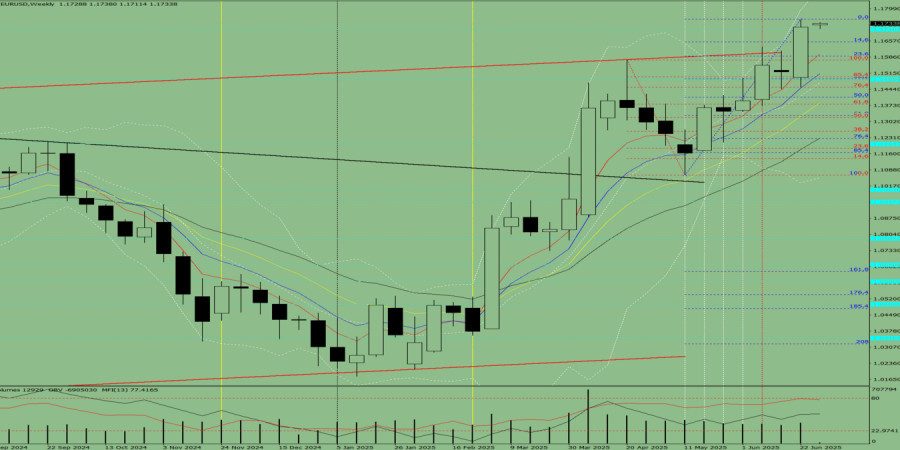
This week, the market may start declining from the 1.1718 level (the closing of the last weekly candle), targeting 1.1652 — the 14.6% retracement level (blue dashed line). Upon testing this level, the price may reverse upward toward 1.1709 — the historical resistance level (blue dashed line).
Fig. 1 (Weekly Chart)
Conclusion based on comprehensive analysis: downward movement
The price is most likely to exhibit a bearish trend throughout the week, with no upper shadow on the weekly black candle (indicating downward movement on Monday), and a lower shadow appearing by Friday (indicating a potential upward move at the end of the week).
From the 1.1718 level (closing of the last weekly candle), the pair may begin a downward movement toward 1.1590 — the 23.6% retracement level (blue dashed line). Upon testing this level, the price may rebound upward toward 1.1652 — the 14.6% retracement level (blue dashed line).

HIZLI BAĞLANTILAR
show error
Unable to load the requested language file: language/turkish/cookies_lang.php
date: 2025-07-05 04:00:45 IP: 216.73.216.33


 Bize Ulaşın

