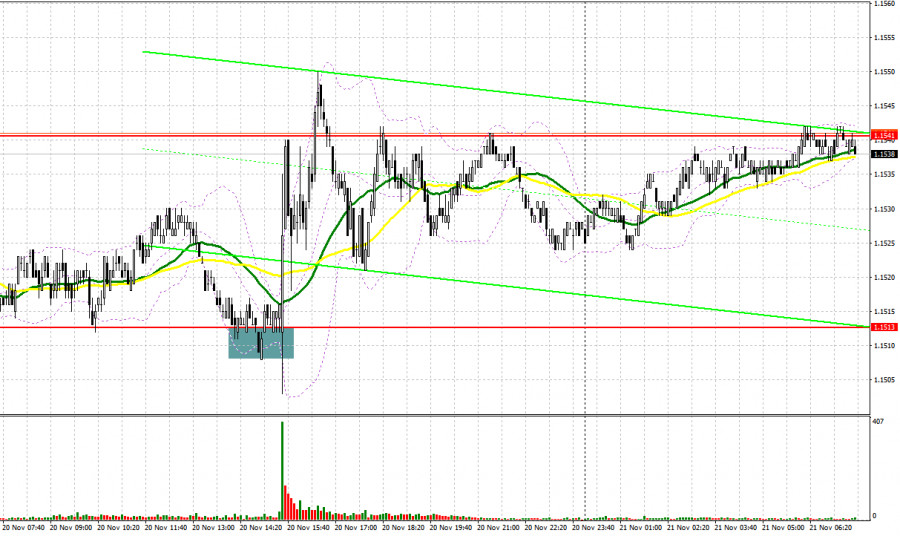
Yesterday, several suitable entry points into the market were formed. Let's take a look at the 5-minute chart and analyze what happened. In my morning forecast, I highlighted the level at 1.1521 and planned to make entry decisions based on it. The rise and formation of a false breakout at 1.1521 led to a sell entry for the euro, but after a 10-pip decline, the pressure on the pair eased. In the second half of the day, long positions on the false breakout at 1.1513 led to an increase of more than 40 pips in the pair.
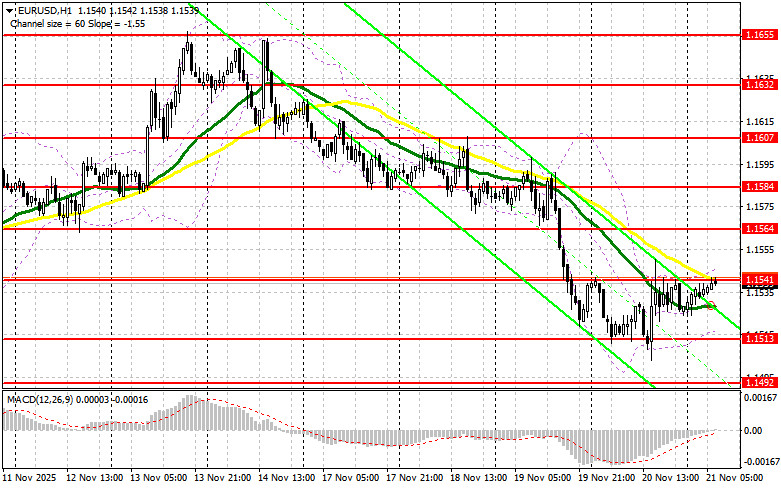
The US unemployment rate rose again in September to 4.4%, significantly weakening the US dollar and increasing the likelihood of US interest rate cuts. This led to a momentary increase in the euro; however, breaking the bearish market observed this week has not yet been achieved. In the first half of the day, data on the manufacturing PMI index for the Eurozone, the services PMI index, and the composite PMI index are expected. Shortly thereafter, European Central Bank President Christine Lagarde will give a speech. Weak reports, especially in the manufacturing sector, could lead to a decline in the euro, which could be exploited. I expect the first signs of buyers only around the support level of 1.1513, formed at the end of yesterday. If a false breakout forms there, it will provide an entry point for long positions with a target to recover the pair to the resistance of 1.1541, below which trading is currently occurring. A breakthrough and a retest of this range will confirm the right actions to buy the euro, with the expectation of a larger surge in the pair toward 1.1564. The furthest target will be last week's high of 1.1584, where I will take profit. Testing this level will halt the bearish market's development. If the EUR/USD declines and there is no activity around 1.1513, pressure on the pair will only increase by the end of the week. Sellers will likely reach the next interesting level of 1.1492. Only the formation of a false breakout there would be a suitable condition for buying the euro. Long positions will be immediately opened on the rebound from 1.1472 with a target of an upward correction of 30-35 pips intraday.
Sellers did everything yesterday to prevent the pair from rising above 1.1541. This level is emphasized in the first half of the day today. If the euro rallies following the Eurozone data, the bears will aim to defend the 1.1541 resistance. A false breakout there will provide an entry point for short positions with a target to move the pair toward support at 1.1513. A breakthrough and consolidation below this range, as well as a retest from below, will become another suitable option for opening short positions in the area of 1.1492, which will reinforce the bearish trend. The furthest target will be the 1.1472 area, where I will take profit. If the EUR/USD moves higher and there are no active bearish actions around 1.1541, buyers will have a good opportunity by the end of the week. In this case, short positions are best delayed until the larger level of 1.1564. Selling will occur only after a failed consolidation. I plan to open short positions immediately on a rebound from 1.1584 with a target for a downward correction of 30-35 pips.
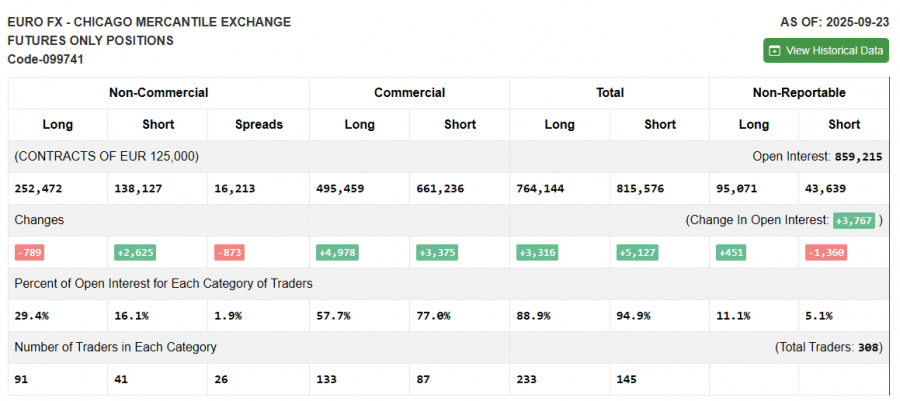
Due to the shutdown in the US, fresh data on the Commitment of Traders is not being published. The last relevant data is only from September 23.
In the COT report (Commitment of Traders) for September 23, there was an increase in short positions and a decrease in long positions. Expectations of further Federal Reserve interest rate cuts continue to pressure the US dollar. However, the number of euro buyers is not increasing, as political problems in France and the risks of a new inflation rise force the ECB to act much more cautiously, slowing down economic growth. The COT report indicates that long non-commercial positions decreased by 789 to 252,472, while short non-commercial positions increased by 2,625 to 138,625. As a result, the spread between long and short positions narrowed by 873.
Moving Averages: Trading is occurring around the 30 and 50-day moving averages, indicating market uncertainty.
Note: The periods and prices of moving averages are viewed by the author on the hourly chart (H1) and differ from the general definition of classic daily moving averages on the daily chart (D1).
Bollinger Bands: In the event of a decline, the indicator's lower boundary around 1.1513 will act as support.

RÁPIDOS ENLACES


 Contáctenos