The EUR/USD currency pair traded with minimal volatility on Monday, as anticipated, making it pointless to discuss whether the price rose or fell over the past day. A movement of 40 pips in 24 hours is market noise. The same applies to the fundamental background. Yesterday, it became known that the U.S. "shutdown" may soon end, which should, in theory, support the dollar. We observed a brief strengthening of the U.S. currency during the American trading session. But why didn't the dollar rise in the morning? Why did it strengthen over the last month and a half while the "shutdown" was ongoing? There is certainly no logic in Monday's movements.
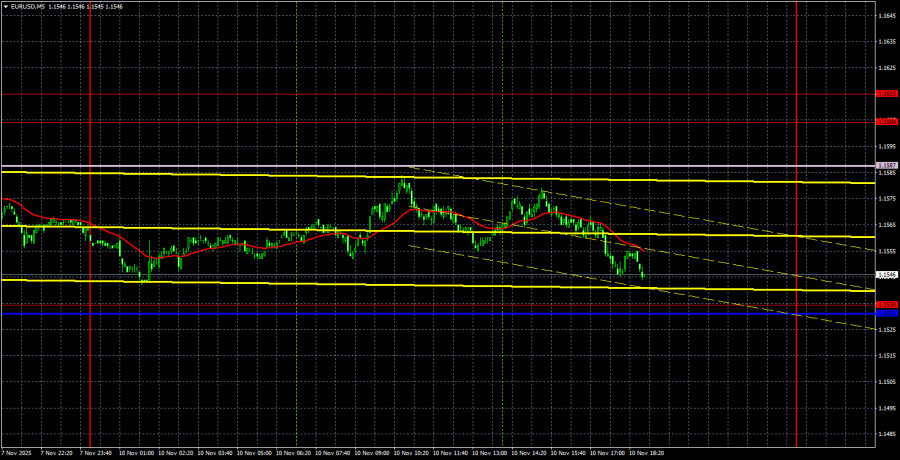
From a technical perspective, the situation is quite straightforward. The price reached the Senkou Span B line and bounced off it, as expected. This line will likely be breached this week, but it won't happen on the first attempt. If the breach occurs, then a full-fledged upward trend can be anticipated. A slight pullback will create a second support point for the trend line.
On the 5-minute timeframe, no trading signals were generated yesterday, although the price did approach the Senkou Span B line and worked with a small margin. Thus, we believe that the bounce from this line provoked the decline. This means that we are again talking about purely technical factors driving the pair's movement.
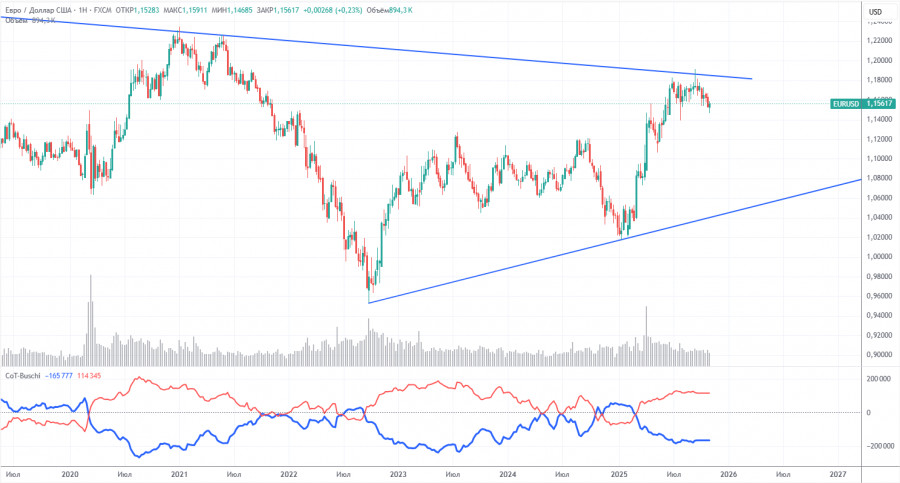
The latest COT report is dated September 23. Since then, no further COT reports have been published due to the U.S. "shutdown." In the illustration above, it is clear that the net position of non-commercial traders has long been "bullish," with bears struggling to gain the upper hand at the end of 2024 but quickly losing it. Since Trump took office for a second term as President of the U.S., the dollar has been falling. We cannot assert that the decline of the American currency will continue with 100% probability, but current world events suggest that this may be the case.
We still do not see any fundamental factors that would strengthen the euro, while there remain sufficient factors that would weaken the dollar. The global downtrend is still ongoing, but what difference does it make where the price moved in the last 17 years? Once Trump concludes his trade wars, the dollar may start to rise, but recent events indicate that the war will continue in one form or another for a long time yet.
The position of the red and blue lines of the indicator continues to indicate the preservation of a "bullish" trend. During the last reporting week, the number of long positions in the "Non-commercial" group decreased by 800, while the number of shorts increased by 2,600. Consequently, the net position decreased by 3,400 contracts over the week. However, this data is already outdated and holds no significance.
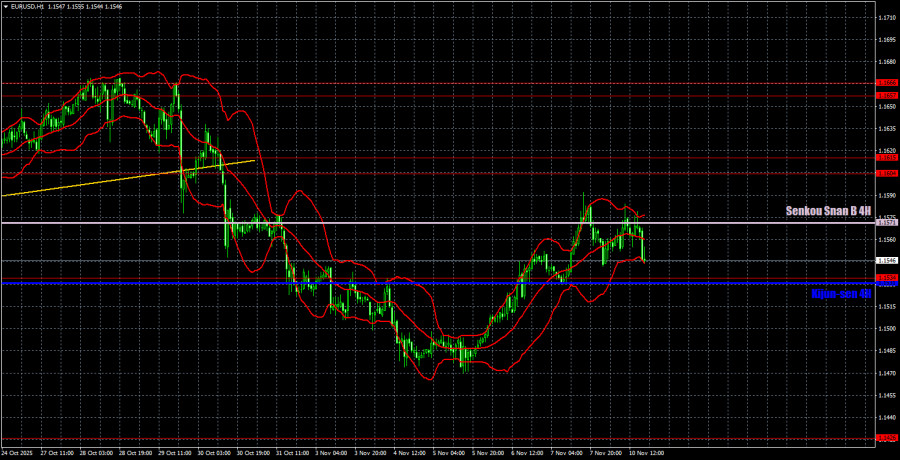
On the hourly timeframe, the EUR/USD pair continues to form another downward trend. There is currently no trend line, so we can only rely on the Ichimoku indicator lines. If Senkou Span B is breached, it indicates the trend will turn upward. We believe that the main reason for the inadequate and illogical movements lately is the flat condition on the daily timeframe. This flat condition is still ongoing. As the price approached the lower boundary of the sideways channel, a local upward trend may be imminent on the hourly timeframe.
For November 11, we identify the following levels for trading: 1.1234, 1.1274, 1.1362, 1.1426, 1.1534, 1.1604-1.1615, 1.1657-1.1666, 1.1750-1.1760, 1.1846-1.1857, 1.1922, 1.1971-1.1988, as well as Senkou Span B (1.1571) and Kijun-sen (1.1531). The Ichimoku indicator lines may move throughout the day, which should be taken into account when determining trading signals. Don't forget to set a Stop Loss order to break even if the price moves in the right direction by 15 pips. This will protect against potential losses if the signal turns out to be false.
On Tuesday, the European Union is scheduled for a speech by European Central Bank President Christine Lagarde, as well as the publication of ZEW indexes. We cannot classify any of these events as significant, even the speech by Lagarde. Volatility may again be weak.
On Tuesday, traders may anticipate a resumption of growth if Senkou Span B is breached or if a bounce occurs from the Kijun-sen line. In this case, long positions can be opened with a target of 1.1604-1.1615. Short positions may be considered if the price consolidates below the critical line, but significant movement should not be expected.

RÁPIDOS ENLACES


 Contáctenos