Celní ofenziva prezidenta Trumpa přinesla několik předběžných dohod – například 90denní příměří v celní válce s Čínou a dílčí obchodní dohodu s Británií – ale podle analytiků k vyvážení globálních obchodních toků stále nedošlo.
Víkendové příměří s Čínou vyvolalo růst akcií a mohlo oddálit dopady růstu cen a nedostatku kritických surovin do srpna, nicméně neřeší hlavní stížnosti USA vůči Číně, zejména státem řízený model ekonomiky zaměřený na export.
Naopak bylo stanoveno krátké časové okno pro náročná vyjednávání nejen s Pekingem, ale i s desítkami dalších zemí, které čelí termínu 8. července, aby se vyhnuly vyšším clům.
Brzy se očekávají další dohody například se Švýcarskem, Indií a Japonskem, ale půjde pouze o rámcové dohody s potřebou dalšího vyjednávání. Trvalé změny v dodavatelských řetězcích a obchodních tocích potrvají roky.
„Je příliš brzy na hodnocení. Teprve čas ukáže, jestli šlo o úspěšnou strategii,“ řekla bývalá obchodní poradkyně Bidenovy administrativy Greta Peisch.
Kelly Ann Shaw, bývalá poradkyně Trumpa, však uvedla, že prezident si zaslouží uznání za to, že přiměl Čínu, Británii a další k jednacímu stolu.
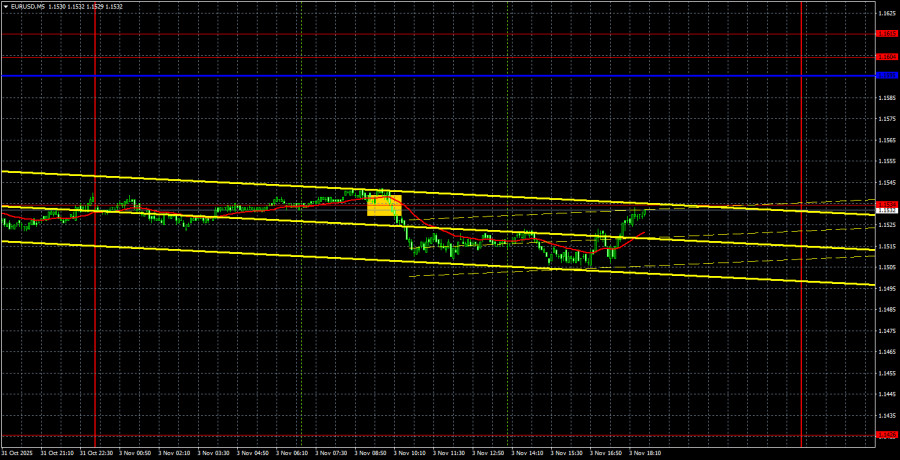
The EUR/USD currency pair traded with less than 40 pips of volatility on Monday. This article could almost end here, as it is clear that no macroeconomic report had any impact on the market. The US dollar did not weaken once again, even when it had every reason to, thus continuing the completely illogical downward movement. Let's take a closer look at the ISM manufacturing activity index for the US, which was the most important report from yesterday. Traders expected the business activity index to rise to 49.5 points for October. In reality, it dropped to 48.7 points. The report itself was significant, and its results were resonant; however, we essentially saw no market reaction. After the release of this report, the US dollar dropped by 20 pips—what are 20 pips? And what significance do they hold when, in the first half of the day, the dollar gained those same 20 pips without any reason for growth?
Thus, by the end of Monday, it can be stated that illogical movements continue. The price once again broke through another ascending trend line last week; therefore, from a technical perspective, the downward trend remains intact.
On the 5-minute timeframe, one sell trading signal was formed yesterday, after which the price fell by 20 pips, as mentioned. These 20 pips were enough for traders to set a Stop Loss to breakeven on the short position.

The last COT report is dated September 23. Since then, no COT reports have been published due to the US "shutdown". The illustration above clearly shows that the net position of non-commercial traders has long been "bullish," with bears struggling to gain the upper hand at the end of 2024 but quickly losing it again. Since Trump's reelection as US president, only the dollar has been falling. We cannot assert with 100% certainty that the decline of the American currency will continue, but current developments around the world suggest this is a possibility.
We still do not see any fundamental factors that would strengthen the European currency, while there remain sufficient factors for the decline of the American one. The global downward trend remains, but it is unclear how much significance the price movement over the last 17 years retains now. Once Trump ends his trade wars, the dollar may begin to rise, but recent events show that the conflict will continue in one form or another for a long time.
The positioning of the red and blue lines of the indicator continues to indicate the persistence of a "bullish" trend. During the last reporting week, the number of long positions for the Non-commercial group decreased by 800, while short positions increased by 2,600. Consequently, the net position decreased by 3,400 contracts over the week. However, this data is already outdated and holds no significance.

On the hourly timeframe, the EUR/USD pair could have completed a downward trend two weeks ago, but instead completed an upward one. Recently, the European currency has been declining, and it remains difficult to find explanations that aren't from the realm of science fiction. We believe that the main reason for the inadequate and illogical movements is the flat pattern on the daily timeframe. This flat continues to persist.
For November 4, we highlight the following trading levels: 1.1234, 1.1274, 1.1362, 1.1426, 1.1534, 1.1604-1.1615, 1.1657-1.1666, 1.1750-1.1760, 1.1846-1.1857, 1.1922, 1.1971-1.1988, as well as the Senkou Span B line (1.1653) and Kijun-sen line (1.1588). The Ichimoku indicator lines may shift throughout the day, which should be taken into account when determining trading signals. Don't forget to set your Stop Loss to breakeven if the price moves in the right direction by 15 pips. This will protect against potential losses if the signal turns out to be false.
On Tuesday, two speeches from European Central Bank President Christine Lagarde are scheduled in the Eurozone, but they hold no value for traders. Just last week, the ECB held another meeting, and the market received comprehensive information on how the ECB intends to act.
On Tuesday, traders can expect the decline to continue and may trade from the 1.1534 level. As mentioned earlier, given the flatness on the daily timeframe, the euro's decline may continue on technical grounds, but volatility remains very low.

RÁPIDOS ENLACES


 Contáctenos