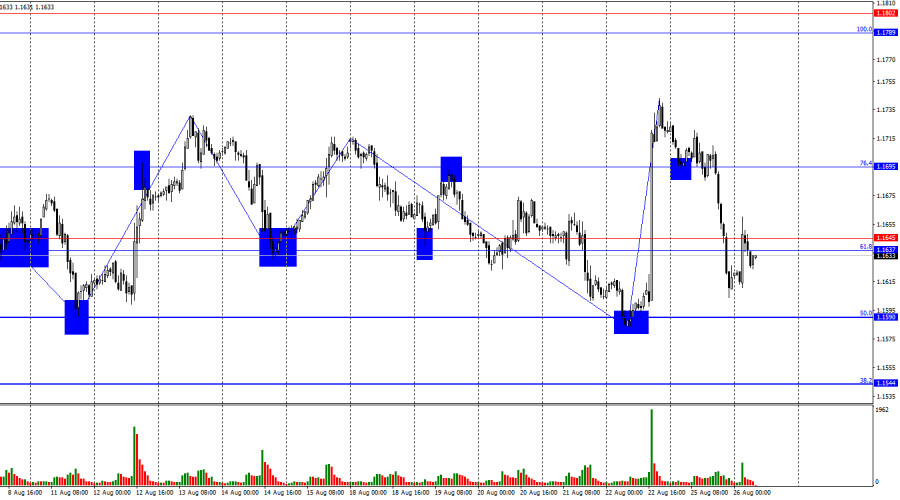
On Monday, EUR/USD reversed in favor of the U.S. currency and declined sharply. However, this decline can be overlooked, just like the previous rally. The hourly chart clearly shows that the pair has moved into a new sideways channel. Up and down waves alternate with each other and are almost identical in size. Within such a range, many trading signals can turn out to be false. Today, consolidation above the resistance zone of 1.1637–1.1645 would allow for a return to the 76.4% retracement level at 1.1695.
The wave situation on the hourly chart remains simple and clear. The last completed downward wave did not break the lows of the previous waves, while the last upward wave broke through nearly all recent peaks. Thus, the trend may once again turn "bullish," although the risk of sideways movement remains. Recent labor market data and shifting Fed policy expectations are supporting bullish traders.
On Monday, there were no economic releases. For most of the day, traders were resting and digesting Jerome Powell's Friday speech. This pause proved useful, as in the second half of the day bears went on the offensive, which has a logical explanation. As I mentioned yesterday, Powell did not give a single hint that the FOMC would cut rates in September. The picture looks like this: traders were almost certain of easing at the next meeting, but Powell, when speaking of possible cuts, planted doubts about that assumption. In truth, the dollar should have risen on Friday. Perhaps not strongly, but a rise would have been more consistent. On Monday, after another review of Powell's comments, traders seemed to reach exactly that conclusion. The dollar strengthened, but whether it can continue to rise is questionable. The market is in a sideways range.
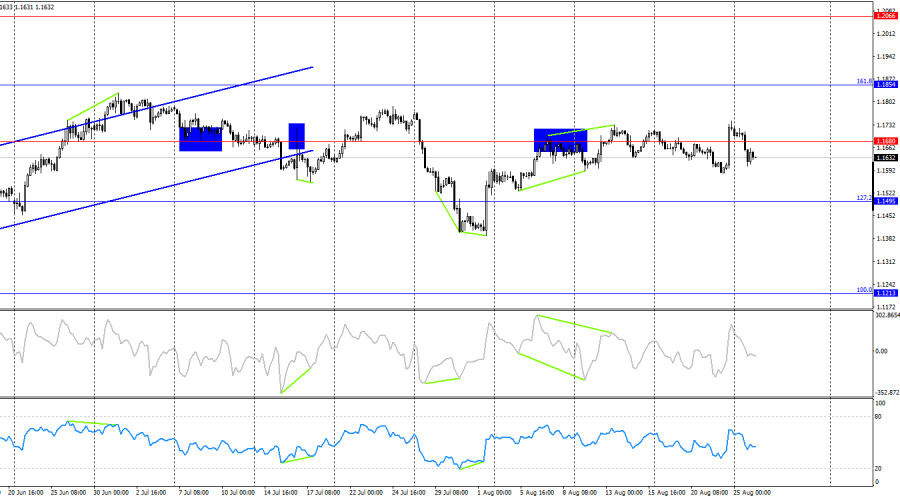
On the 4-hour chart, the pair made a new reversal in favor of the U.S. currency and consolidated below 1.1680. This level has recently been crossed frequently, so I do not recommend focusing on it. The picture on the hourly chart is much more informative and contains more levels. No signs of divergence are visible on any indicators today. The 4-hour chart also clearly shows sideways movement.
Commitments of Traders (COT) Report:
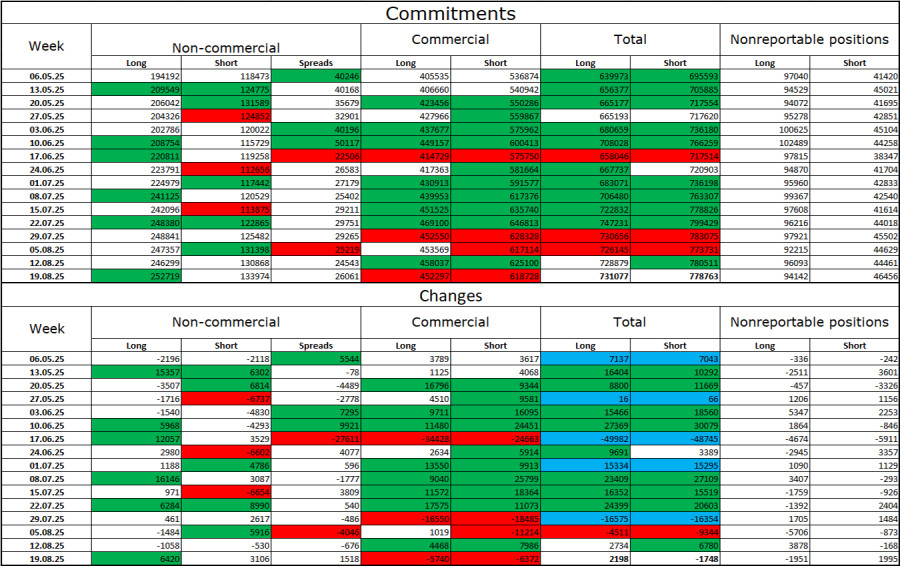
During the last reporting week, professional traders opened 6,420 long positions and 3,106 short positions. Sentiment among the "Non-commercial" group remains bullish, largely due to Donald Trump, and is strengthening over time. The total number of long positions held by speculators now stands at 253,000, compared to 134,000 short positions. The gap is almost two-to-one. Also note the number of green cells in the table above, reflecting a strong build-up of positions in the euro. In most cases, interest in the euro is rising, while interest in the dollar is falling.
For 28 consecutive weeks, large players have been reducing shorts and increasing longs. Donald Trump's policies remain the most significant factor for traders, as they may create long-term structural problems for the U.S. Despite the signing of several important trade agreements, some key economic indicators continue to show decline.
News Calendar for the U.S. and the Eurozone:
On August 26, the economic calendar contains only this important release. Its impact on market sentiment will therefore be felt in the second half of the day.
EUR/USD Forecast and Trading Tips: Selling the pair was possible on a close below 1.1695 on the hourly chart, with a target at 1.1637–1.1645. This target has already been reached. I do not recommend considering new sales for now due to the sideways market. Buying opportunities may arise on a close above the 1.1637–1.1645 zone or on a rebound from 1.1590 on the hourly chart with a target at 1.1695.
Fibonacci grids are built at 1.1789–1.1392 on the hourly chart and at 1.1214–1.0179 on the 4-hour chart.

RÁPIDOS ENLACES


 Contáctenos