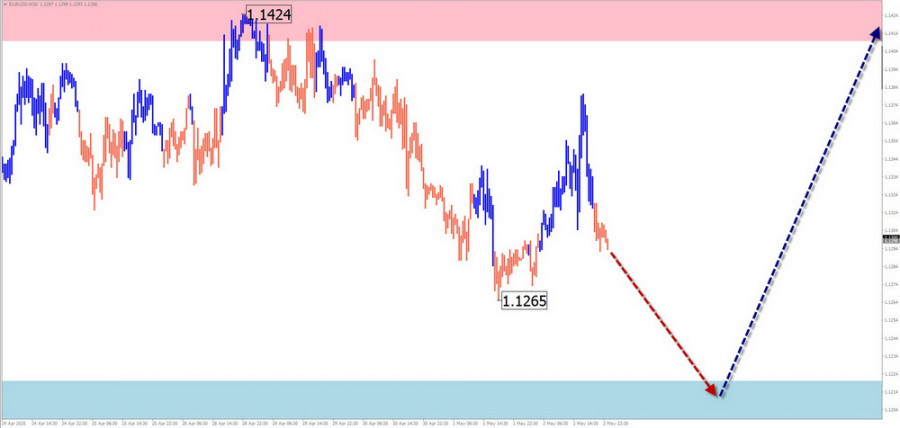
EUR/USD
Analysis:
The hourly chart of the major euro pair shows a dominant upward wave since early February. The correction forming over the past three weeks is nearing completion. The unfinished segment from April 21 is directed downward.
Forecast:
In the upcoming week, a general sideways price movement is expected. In the coming days, a rise toward the calculated support zone is likely. Then, a drift phase is highly probable, followed by a reversal and the start of price growth. The highest volatility is expected at the end of the week.
Potential Reversal Zones:
Recommendations:
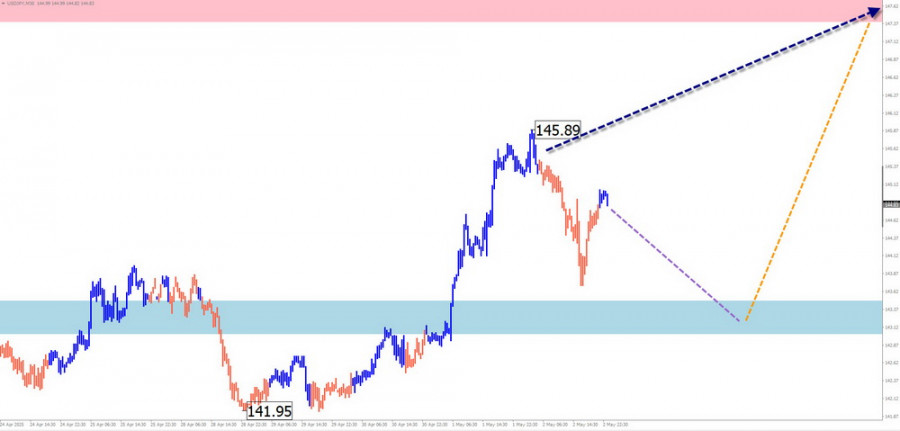
USD/JPY
Analysis:
The dominant downward wave of the yen pair since the end of last year is nearing its end. The bullish segment from April 22 is correcting the last part of the main wave. The wave structure appears as an extended flat and was still incomplete at the time of analysis.
Forecast:
At the beginning of the upcoming week, the price is likely to move within the corridor between nearby opposing zones. After potential pressure on the support zone, a sideways drift is expected. Toward the end of the week, a renewed price rise toward the resistance boundary is possible.
Potential Reversal Zones:
Recommendations:
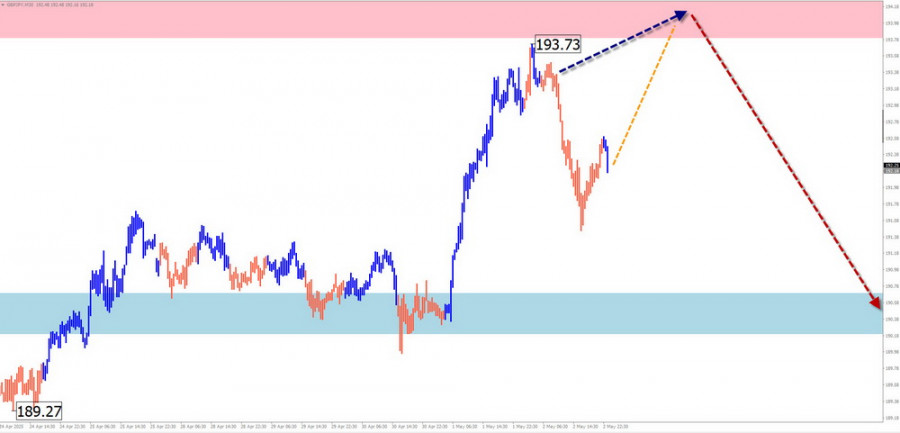
GBP/JPY
Analysis:
The direction of the GBP/JPY cross pair since late August last year has been set by an upward wave. Within this wave, a corrective phase has been forming since the beginning of the year and remains incomplete. The upward section from April 29 fits within the correction of the previous segment.
Forecast:
In the coming days, a flat movement is expected. A short-term rise to the resistance zone is possible. In the second half of the week, volatility is likely to increase, followed by a reversal and a renewed decline. A brief spike beyond the upper resistance limit is possible if the trend changes.
Potential Reversal Zones:
Recommendations:
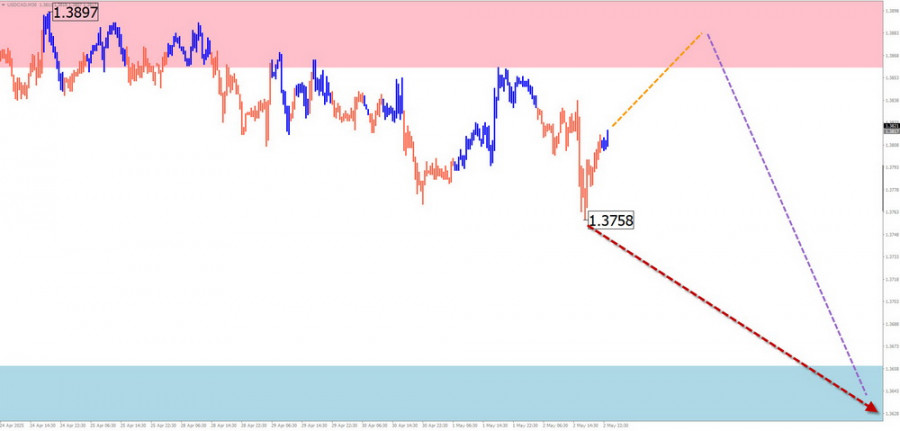
USD/CAD
Analysis:
Since early February, the short-term price direction of the Canadian dollar pair has been governed by a downward wave. The price is approaching the upper boundary of a broad weekly potential reversal zone. Over the past three weeks, the pair has mostly moved sideways, forming a correction. The structure of this wave appears incomplete.
Forecast:
The most likely scenario for the coming days is a gradual shift within a sideways corridor between the nearest opposing zones. After a possible rebound to the upper boundary, prices are expected to decline toward the support zone.
Potential Reversal Zones:
Recommendations:
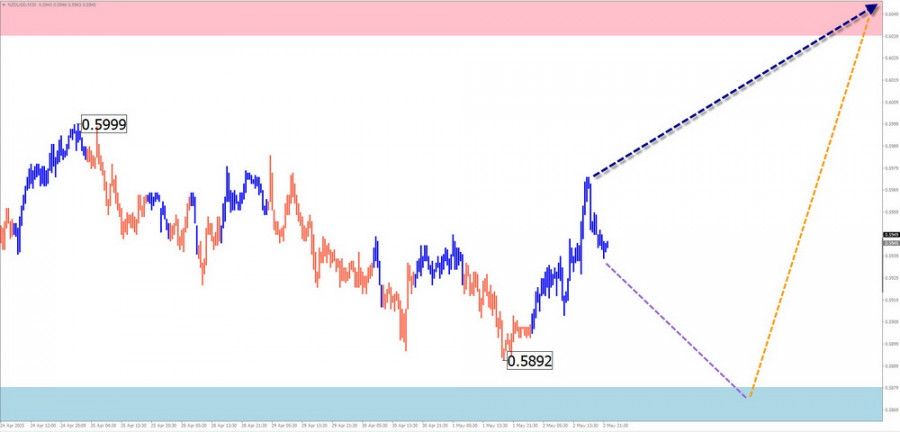
NZD/USD
Brief Analysis:
The short-term incomplete wave structure of the New Zealand dollar is trending "north" on the price chart, originating in early April. The wave is forming its middle section (B) in the shape of a horizontal flat. The resistance boundary lies at the lower edge of a large potential reversal zone on the higher timeframe.
Weekly Forecast:
Throughout the upcoming week, the price is expected to move within the projected range. After reaching the calculated support zone, a rebound upward is likely—but not exceeding the resistance zone.
Potential Reversal Zones:
Recommendations:
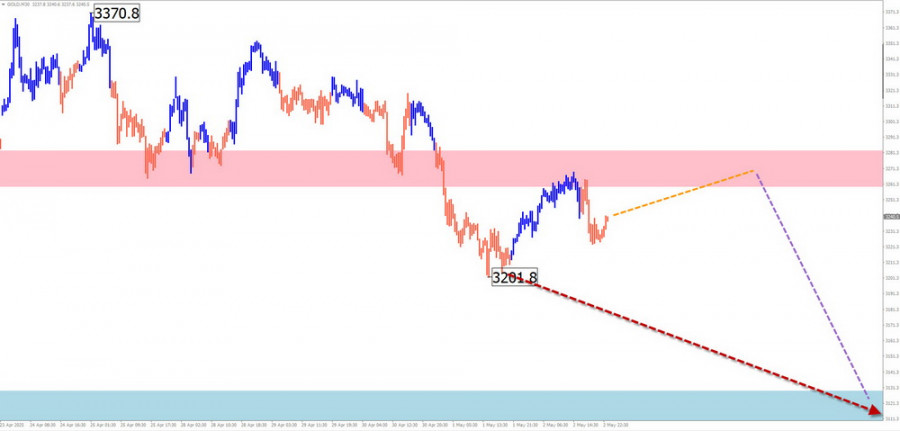
Gold
Analysis:
Gold continues its downward pullback from record highs seen in mid-April. The wave structure is forming an irregular correction, which was still incomplete at the time of analysis and is moving sideways along the projected resistance zone.
Forecast:
In the coming days, gold is likely to stay in a sideways range near the resistance zone. Then, a reversal and renewed decline toward the support zone is expected. A breakout beyond the defined price corridor is possible, but unlikely.
Potential Reversal Zones:
Recommendations:
Note: In simplified wave analysis (SWA), all waves consist of 3 parts (A-B-C). The last unfinished wave is analyzed on each timeframe. Dashed lines indicate expected movements.
Caution: The wave algorithm does not take into account the duration of price movements over time!

RÁPIDOS ENLACES


 Contáctenos