Revisiones analíticas

Las revisiones analíticas de Forexmart proporcionan información técnica actualizada sobre el mercado financiero, que van desde tendencias bursátiles hasta proyecciones financieras, informes de economía mundial y noticias políticas que afectan al mercadoLeer más

Disclaimer:  ForexMart no ofrece asesoría de inversión y el análisis proporcionado no debe interpretarse como una promesa de resultados futuros.

Belgické akcie na konci obchodování vzrostly; BEL 20 o 0,64 %

Belgické akcie byly po uzavření středečního obchodování na vyšší úrovni, když k růstu vedly zisky v sektorech zdravotnictví, spotřebního zboží a základních materiálů.

V závěru obchodování v Bruselu vzrostl index BEL 20 o 0,64 %.

Nejlépe si v rámci BEL 20 vedla společnost Solvay SA (EBR:SOLB), která vzrostla o 3,76 %, tj. o 1,17 bodu, a v závěru se obchodovala na úrovni 32,30 bodu. Mezitím společnost Ackermans & Van Haaren NV (EBR:ACKB) přidala 3,18 %, tj. 5,70 bodu, a uzavřela na 185,00 bodu a společnost Galapagos NV (AS:GLPG) v závěru obchodování vzrostla o 2,40 %, tj. 0,62 bodu, na 26,46 bodu.

Nejhůře si během seance vedla společnost Umicore SA (EBR:UMI), která klesla o 2,53 %, tj. 0,26 bodu, a v závěru se obchodovala na úrovni 10,03 bodu. Melexis NV (EBR:MLXS) klesl o 2,20 %, tj. 1,25 bodu, a uzavřel na 55,65 bodu a KBC Groep NV (EBR:KBC) se snížil o 0,59 %, tj. 0,40 bodu, na 67,50 bodu.

Technical analysis of EUR/USD for December 4-9
04:18 2023-12-04 UTC--5

Trend analysis

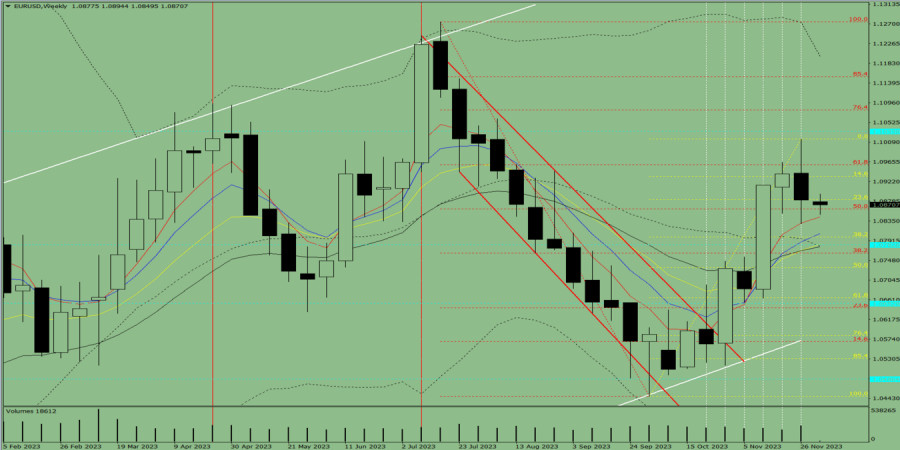
EUR/USD may continue its upward movement this week, rising from the level of 1.0881 (closing price of the last weekly candle) to the upper fractal at 1.1017 (yellow dashed line). It may go further to higher levels after testing the price.

Fig. 1 (weekly chart)

Comprehensive analysis:

Indicator analysis - upward

Fibonacci levels - upward

Volumes - upward

Candlestick analysis - upward

Trend analysis - upward

Bollinger bands - upward

Monthly chart - upward

Conclusion: The indicators point to an upward movement in EUR/USD.

Overall conclusion: The pair will have a bullish trend, with no first lower shadow on the weekly white candle (Monday - upward) and a second upper shadow (Friday - downward).

Therefore, during the week, euro will climb from 1.0881 (closing price of the last weekly candle) to the upper fractal at 1.1017 (yellow dashed line), and then go further to higher levels..

Alternatively, it could move up from 1.0881 (closing price of the last weekly candle) to the upper fractal at 1.1017 (yellow dashed line), followed by a bounce downward.

Comentario

ForexMart is authorized and regulated in various jurisdictions.

(Reg No.23071, IBC 2015) with a registered office at Shamrock Lodge, Murray Road, Kingstown, Saint Vincent and the Grenadines

Restricted Regions: the United States of America, North Korea, Sudan, Syria and some other regions.


© 2015-2025 Tradomart SV Ltd.
Top Top
Advertencia de Riesgo:
El mercado de divisas es altamente especulativo y complejo por naturaleza, y puede no ser adecuado para todos los inversores. Las operaciones en Forex pueden resultar en ganancias o pérdidas sustanciales. Por lo tanto, no es aconsejable invertir dinero que no puede permitirse perder. Antes de utilizar los servicios ofrecidos por ForexMart, reconozca los riesgos asociados con las operaciones en Forex. Busque asesoramiento financiero independiente si es necesario. Tenga en cuenta que ni el rendimiento pasado ni los pronósticos son indicadores confiables de resultados futuros.