Trading Signal for GOLD (XAU/USD) for June 9-12, 2023: sell below 1,970 or buy if rebounds at 1,952 (200 EMA - symmetrical triangle) | Análisis de mercado
 

Revisiones analíticas

Las revisiones analíticas de Forexmart proporcionan información técnica actualizada sobre el mercado financiero, que van desde tendencias bursátiles hasta proyecciones financieras, informes de economía mundial y noticias políticas que afectan al mercadoLeer más

Disclaimer:  ForexMart no ofrece asesoría de inversión y el análisis proporcionado no debe interpretarse como una promesa de resultados futuros.

Trading Signal for GOLD (XAU/USD) for June 9-12, 2023: sell below 1,970 or buy if rebounds at 1,952 (200 EMA - symmetrical triangle)
00:05 2023-06-09 UTC--4

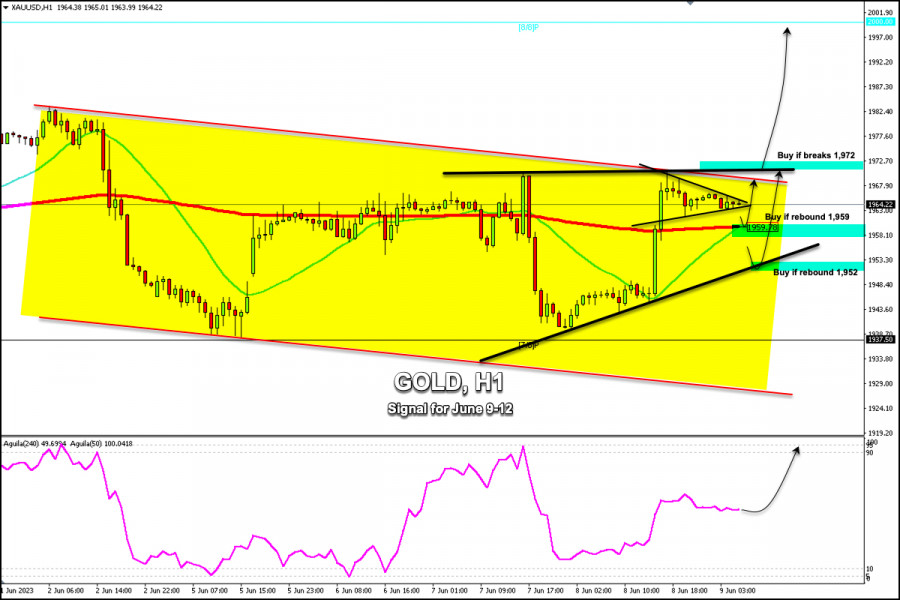
Early in the European session, Gold (XAU/USD) is trading around 1,964.22, above the 21 SMA and above the 200 EMA. Yesterday, the metal recovered from the previous day's sharp decline and is now consolidating to resume its bullish cycle.

Yesterday, gold rallied from a low of 1,939.71, reaching a high of 1,970.64. The US dollar weakened which also affected the strength of US bond yields.

This favored the technical rebound of gold, so the price reached resistance levels around the top of the bearish channel. A recovery of around $30 means that gold could be preparing for a bullish move in the next few days and could reach the psychological level of $2,000. Treasury yields are now falling, with the 10-year yield trading at 3.71%.

The disappointing report from the United States related to employment was worse than expected by analysts. Initial claims for unemployment benefits reached 261,000, expected to fall below 236,000.

According to the 1-hour chart, the odds favor a continuation of the bullish movement in the short term, although gold is showing signs of exhaustion. A sharp break above the top of the uptrend channel around 1,970 could support gold higher and it could reach 1,987 and 8/8 Murray around $2,000.

While gold trades below the key 1,970 level, it is expected to come under strong bearish pressure and the metal could reach the 200 EMA, the zone coinciding with the 21 SMA located at 1,959. In the event of a break, this could push gold down to the bottom of the symmetrical triangle around 1,952. The price action could offer a strong technical bounce.

Our trading plan for the next few hours is to wait for gold to make a technical correction until it reaches the 1,959 zone, which could be seen as an opportunity to buy, with targets at about 1,967. On the other hand, if bearish pressure prevails, we could expect a key bounce zone around 1,952. This move could be used as a buying opportunity with targets at 1,970 and $2,000.

Comentario

ForexMart is authorized and regulated in various jurisdictions.

(Reg No.23071, IBC 2015) with a registered office at Shamrock Lodge, Murray Road, Kingstown, Saint Vincent and the Grenadines

Restricted Regions: the United States of America, North Korea, Sudan, Syria and some other regions.


© 2015-2024 Tradomart SV Ltd.
Top Top
Advertencia de Riesgo:
El mercado de divisas es altamente especulativo y complejo por naturaleza, y puede no ser adecuado para todos los inversores. Las operaciones en Forex pueden resultar en ganancias o pérdidas sustanciales. Por lo tanto, no es aconsejable invertir dinero que no puede permitirse perder. Antes de utilizar los servicios ofrecidos por ForexMart, reconozca los riesgos asociados con las operaciones en Forex. Busque asesoramiento financiero independiente si es necesario. Tenga en cuenta que ni el rendimiento pasado ni los pronósticos son indicadores confiables de resultados futuros.