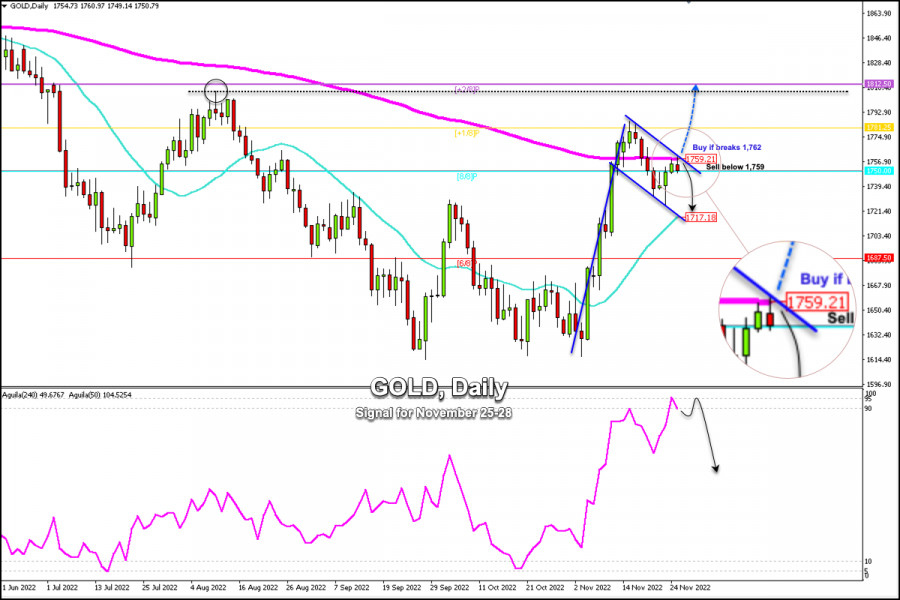
Early in the American session, Gold (XAU/USD) is trading around 1,750, below the 200 EMA (1,759) located on the daily chart, and around the 8/8 Murray.
In the Asian session, the price of the yellow metal reached 1,760, the highest level in six days, but then made a fall reaching 1,750.
The technical rebound in Treasury yields eroded the strength of gold because it is inversely correlated. The 10-year Treasury bond yield is located at 3.70%. In case it continues to rise, it could affect the strength of the gold and it could fall to the psychological level of 1,700.
Gold failed to break sharply through the downtrend channel and the 200 EMA located at 1,759. Since then, it has been showing signs of exhaustion and it is likely to develop a technical correction towards the 21 SMA located at 1,717 in the coming days.
On the daily chart, we can see a bullish pennant pattern which, if a sharp break above 1,762 is confirmed, could be a clear signal to buy. Hence, the price could reach 1,781 (+1/8 Murray) and even +2/8 of Murray at 1,812.
We can see that gold is facing strong resistance around the psychological level of 1,800 and in the area of 1,812. This area will be the key if gold continues to rise. Once these resistances are broken, the metal could reach the highs of June around 1,843 and up to 1,900, which represents the target of the bullish pennant pattern.
On the downside, and for a reversal, gold should close below 1,717 and then, it could hit 6/8 Murray at 1,687 and could even drop to September lows around 1,620.
Our trading plan for the next few hours is to sell below the 200 EMA located at 1,759 with targets at 1,735 and 1,717. The eagle indicator is giving signs of extremely overbought levels. Therefore, a technical correction is imminent in the coming days which supports our bearish strategy.

БЫСТРЫЕ ССЫЛКИ
ForexMart is authorized and regulated in various jurisdictions.
(Reg No.23071, IBC 2015) with a registered office at Shamrock Lodge, Murray Road, Kingstown, Saint Vincent and the Grenadines
Restricted Regions: the United States of America, North Korea, Sudan, Syria and some other regions.


 Контакты